Data Analysis Hub
Abortion Incidence with Third Party Reporting
Recent PMA surveys from Côte d’Ivoire and Nigeria include questions about the abortion experiences of both respondents and other women of reproductive age with whom they share personal information.
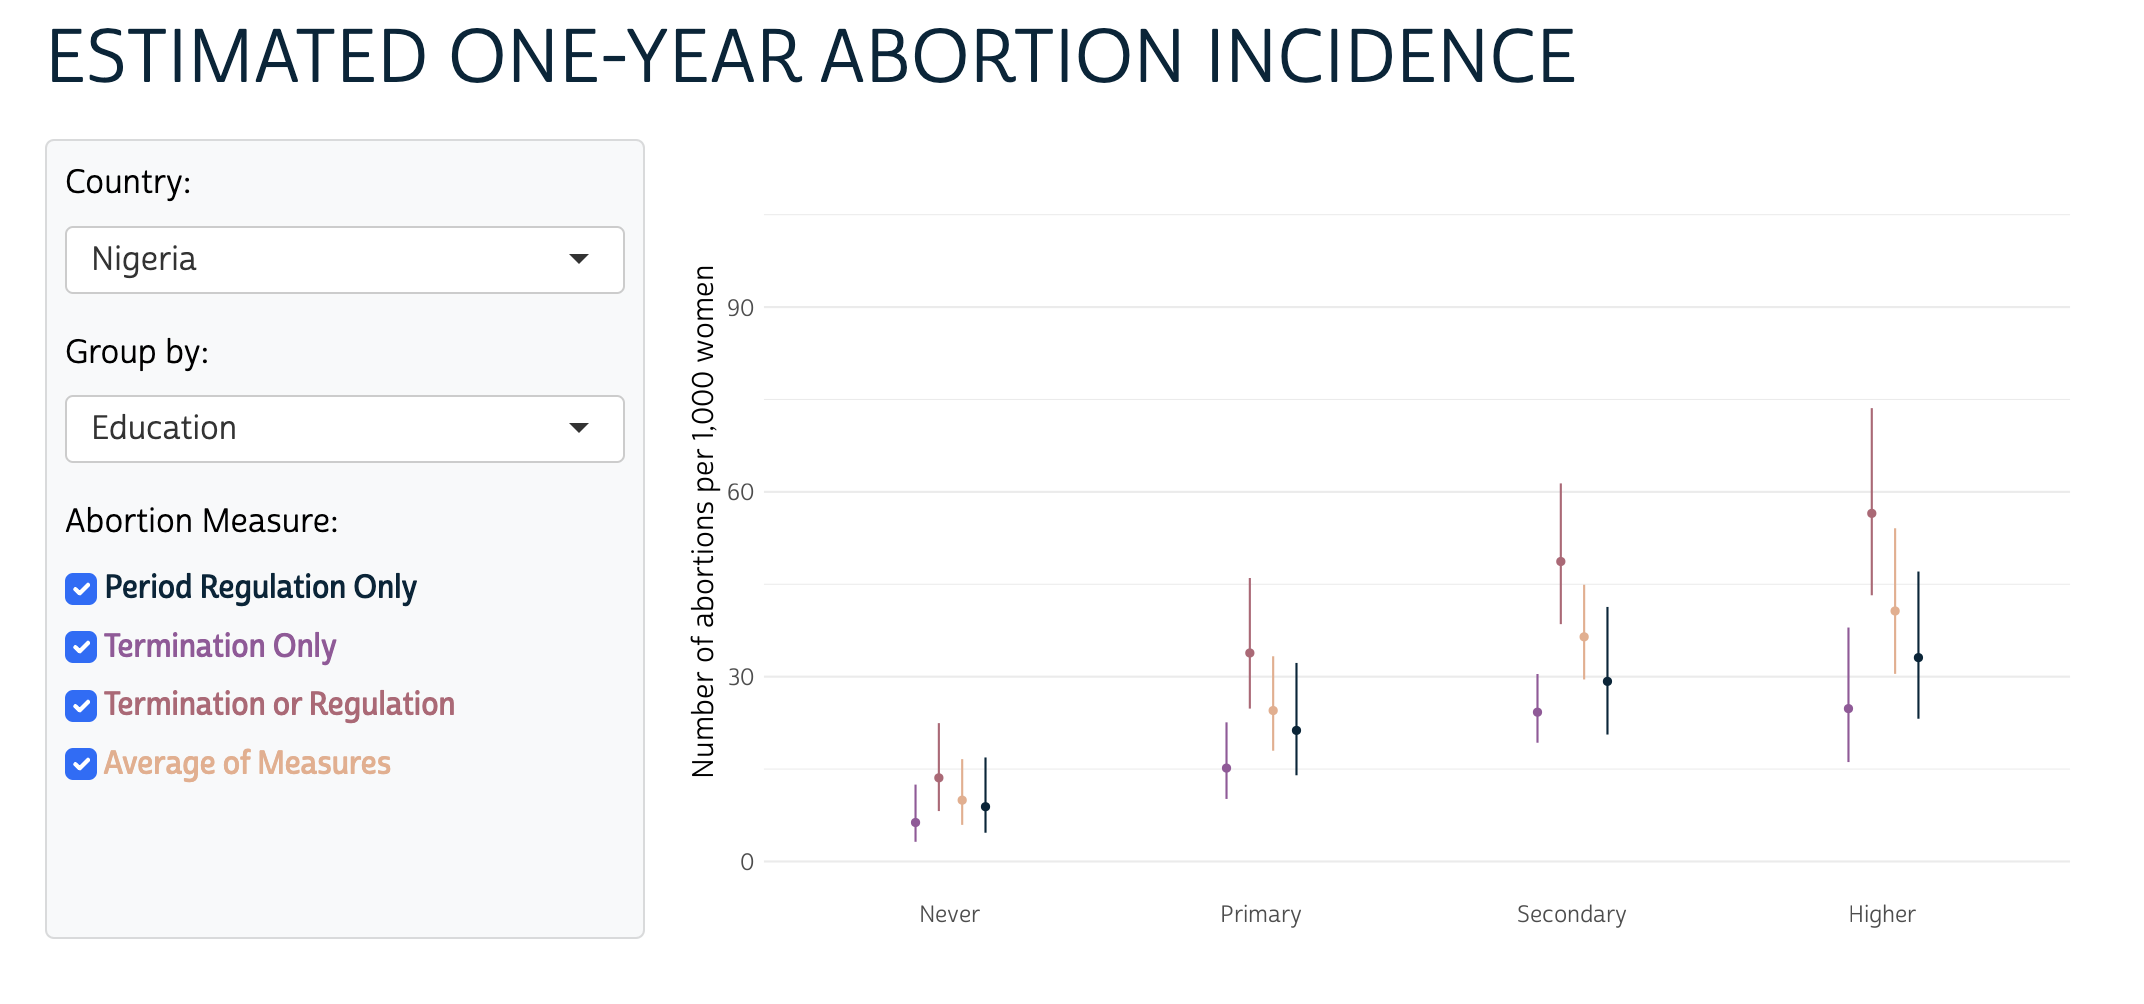
Comparing Measures of Abortion Incidence with a Shiny Dashboard
New abortion data from PMA includes women who reported doing something to remove a pregnancy, or to regulate a late period because of a suspected pregnancy.

New longitudinal data
Follow-up surveys focused on abortion, maternal and newborn health surveys collected during the COVID-19 pandemic, and updates to the ongoing Family Planning panel study
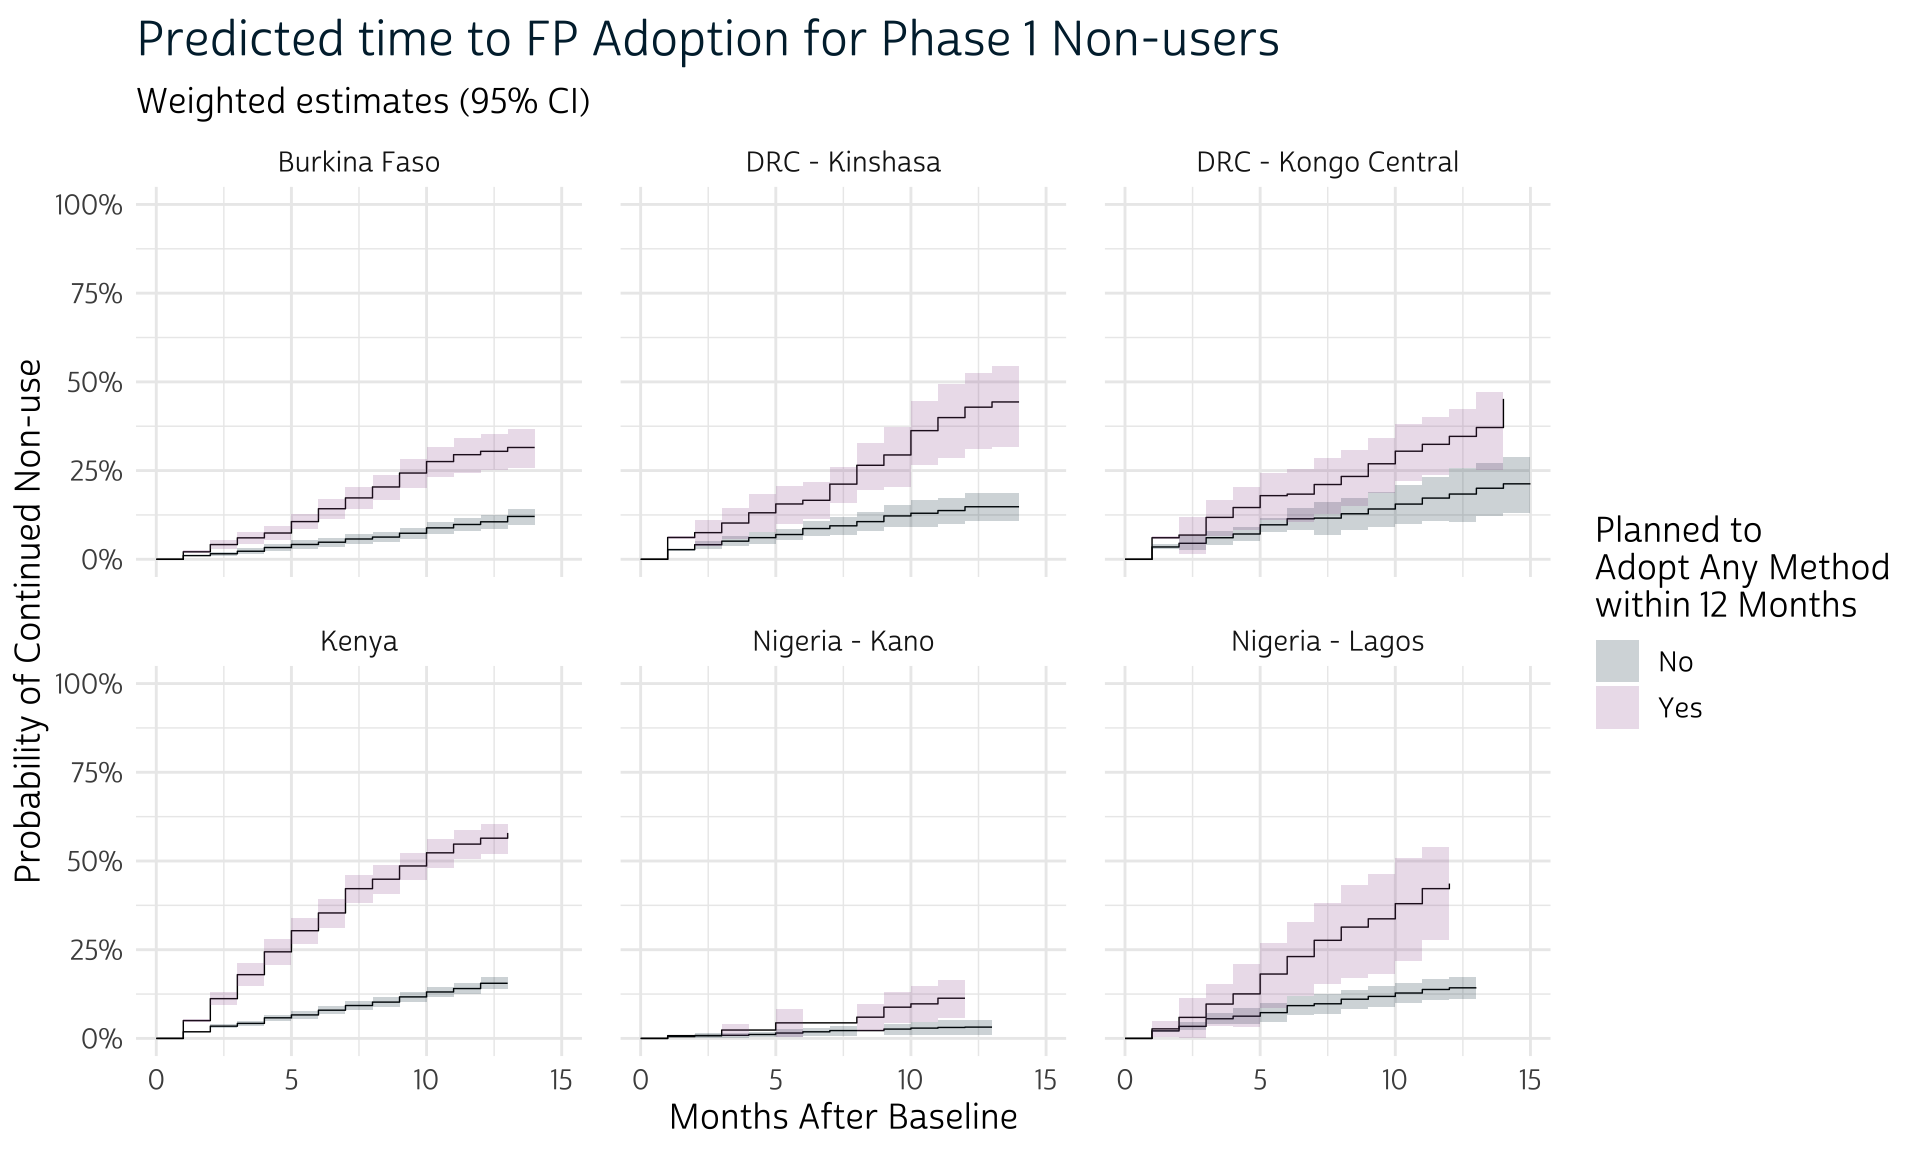
Survival Analysis with Survey Weights
The survey package for R makes it easy to incorpate weights and other elements of survey design into survival analysis.

Building an IPUMS PMA Codebook
You can automatically generate documentation with the metadata included in your data extract, or supplement with additional details scraped from the IPUMS PMA website.
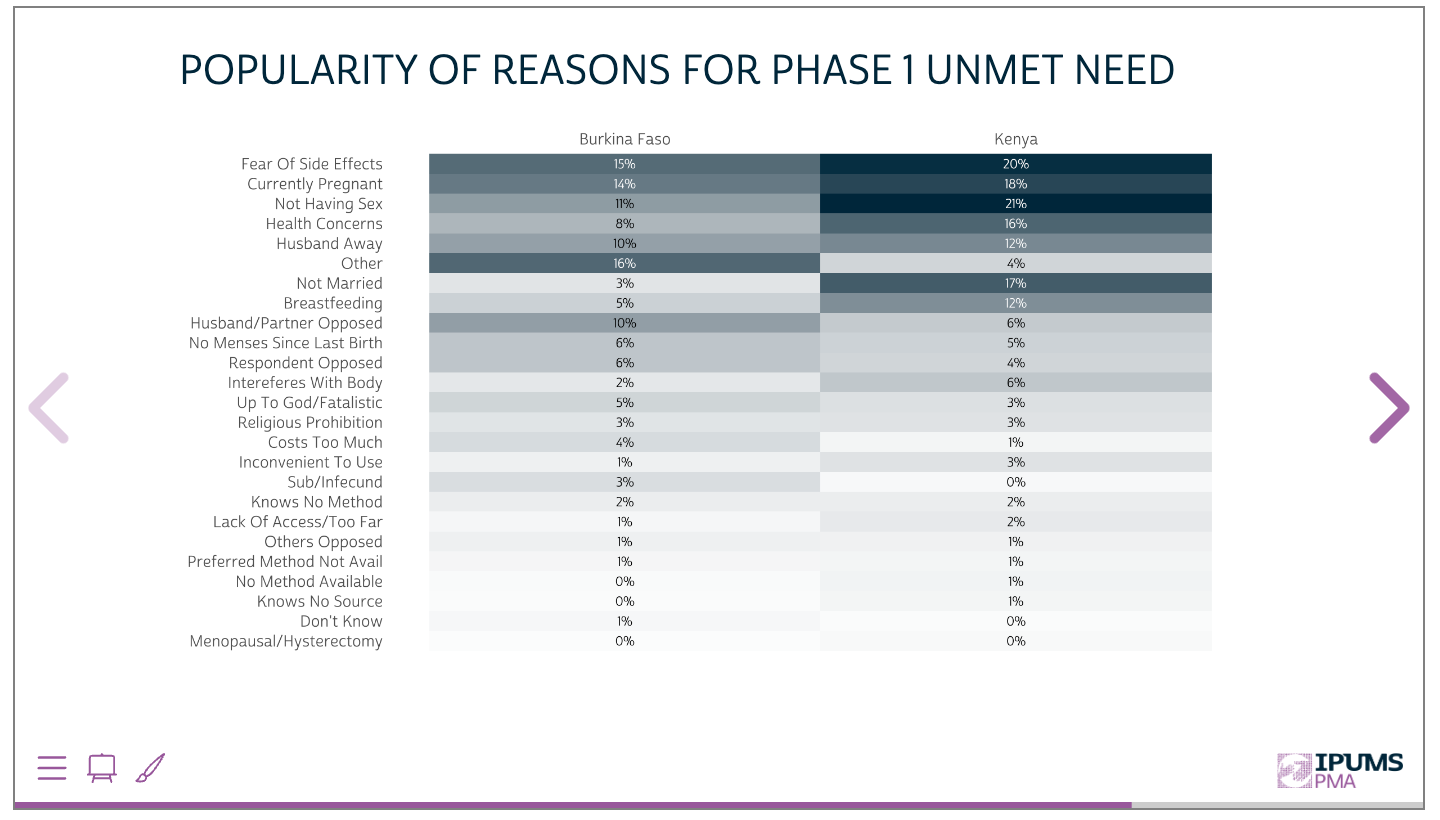
ICFP Workshop: Reasons for Unmet Need
IPUMS PMA hosted a coding workshop at the International Conference on Family Planning in Pattaya City, Thailand this month. Slides for both R and Stata users are available here!
Longitudinal Analysis Guide
Attention Stata users! Our blog series covering the first two phases of PMA panel data is now available in PDF format, with separate versions featuring examples in both R and Stata.
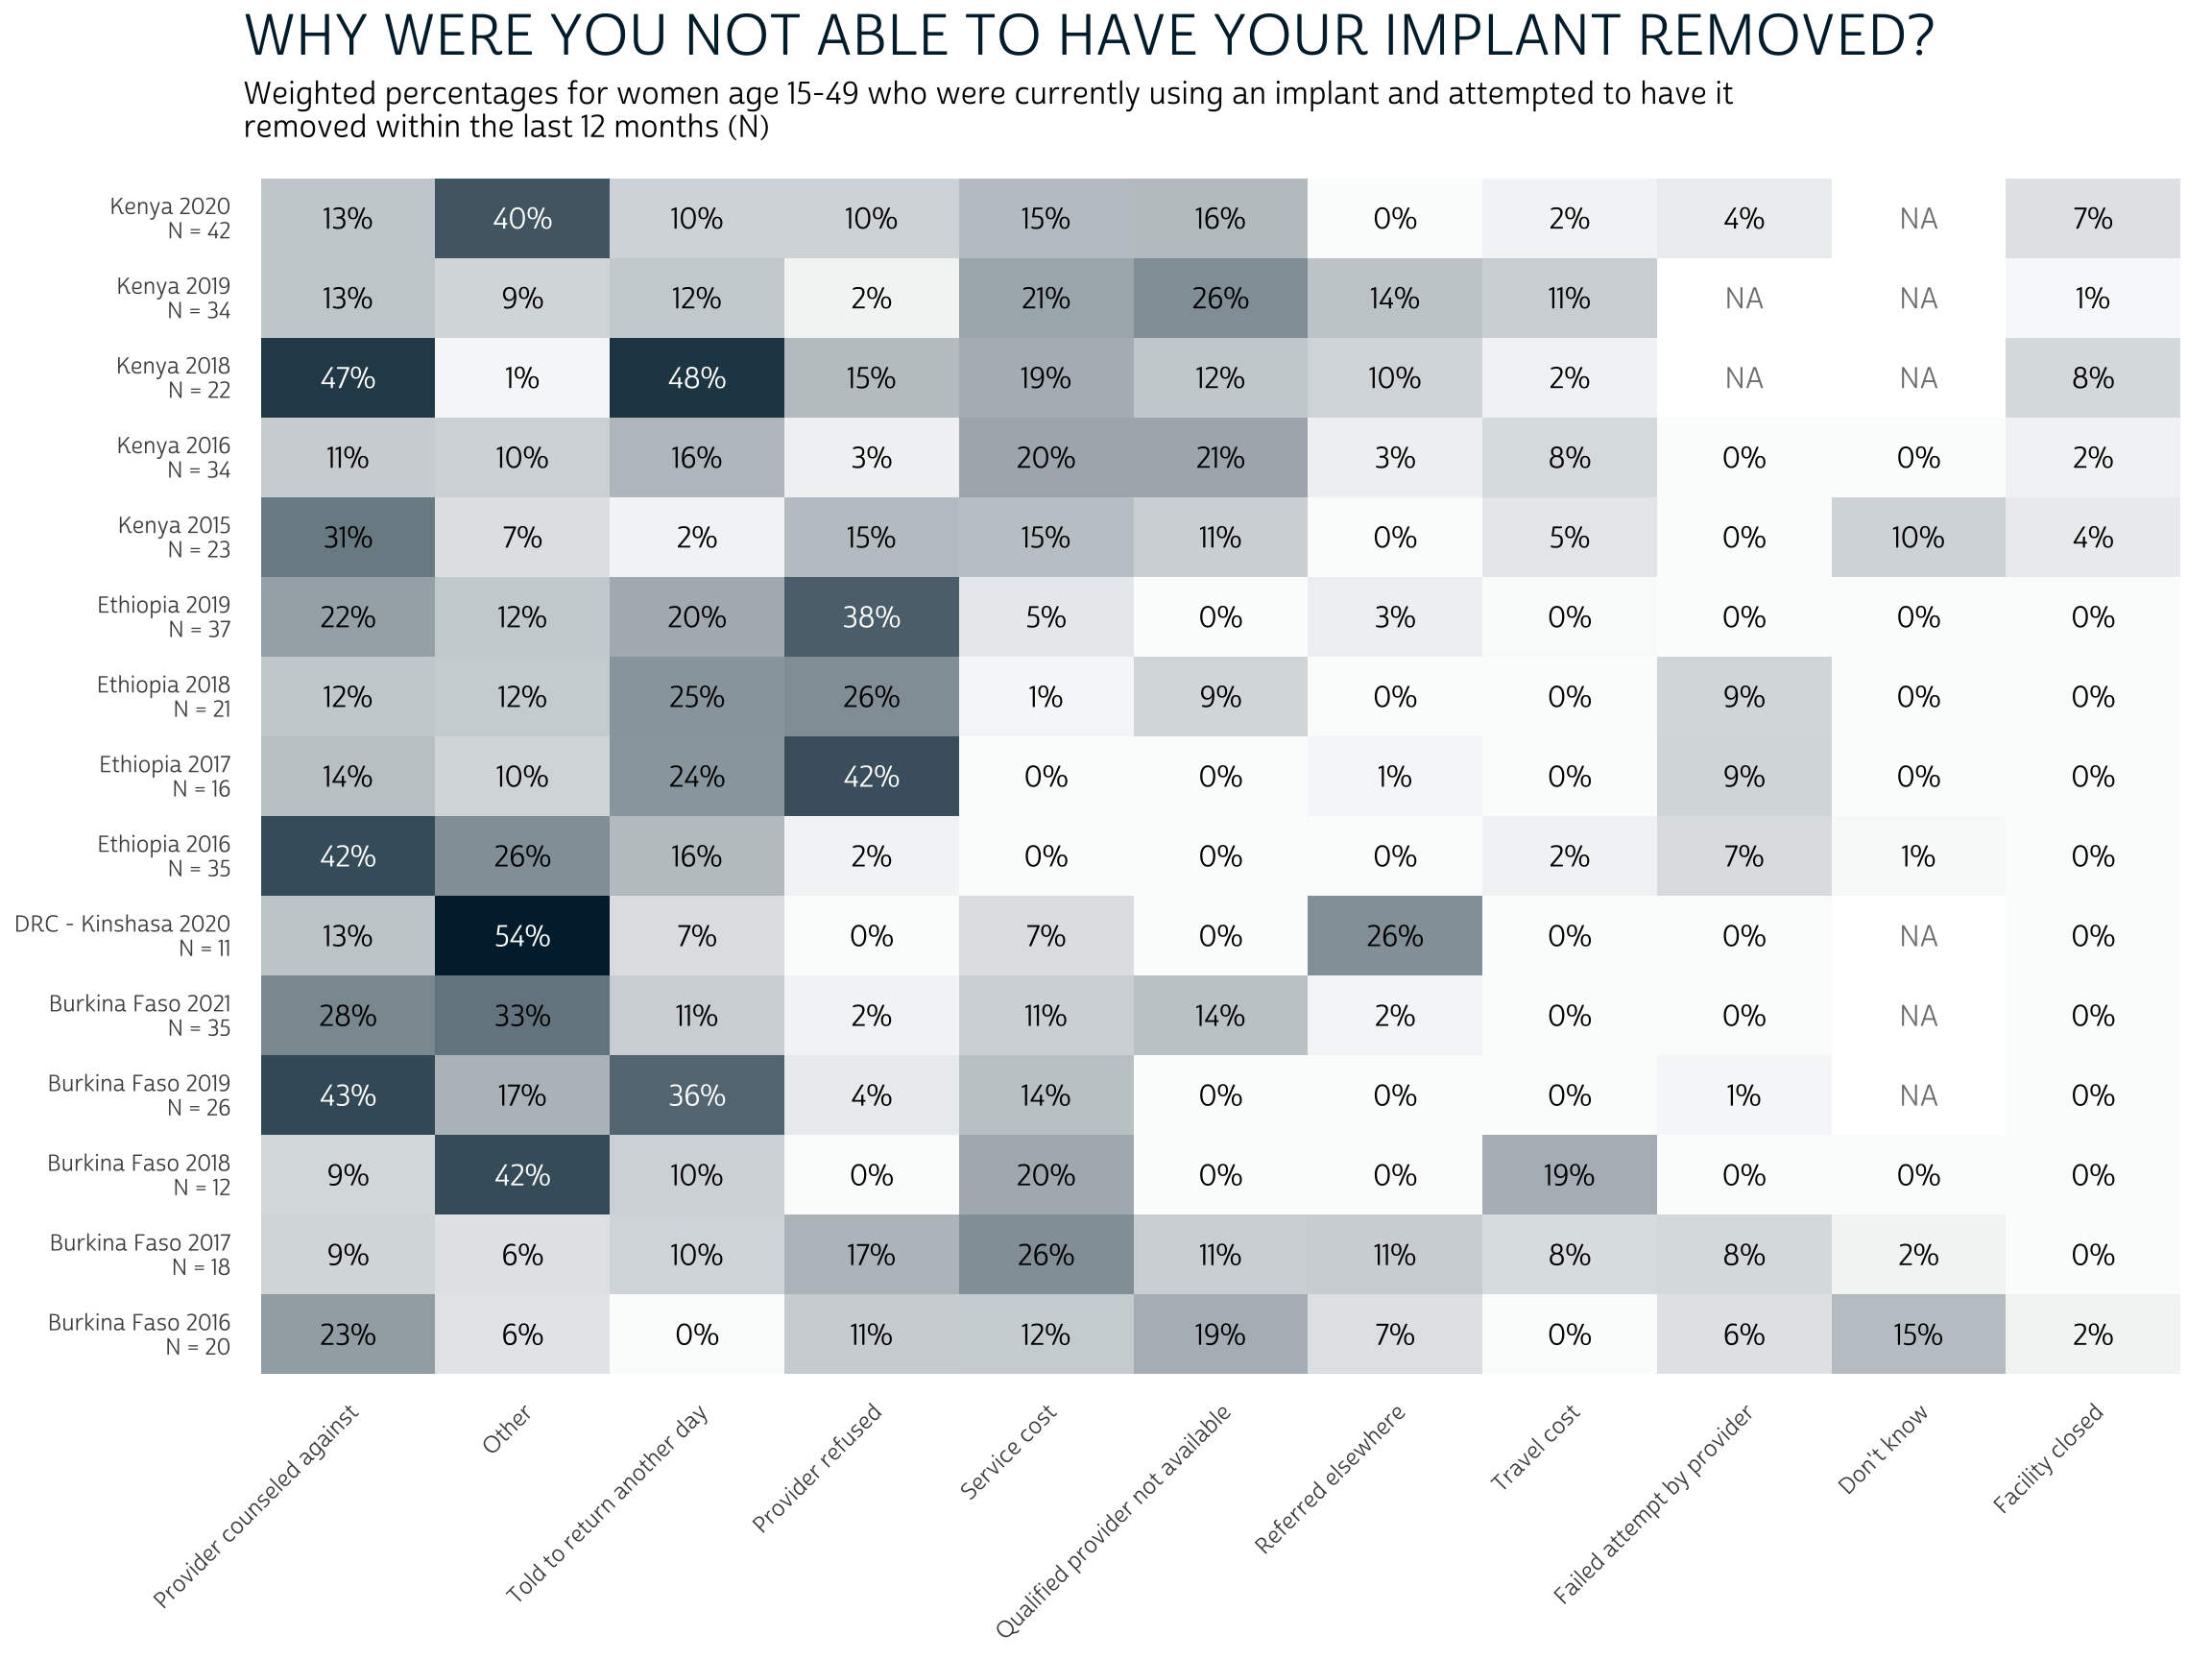
Barriers to Implant Removal
For women who tried and were unable to have their implant removed in the past year, were the main obstacles related to provider willingness, access to services, or something else?
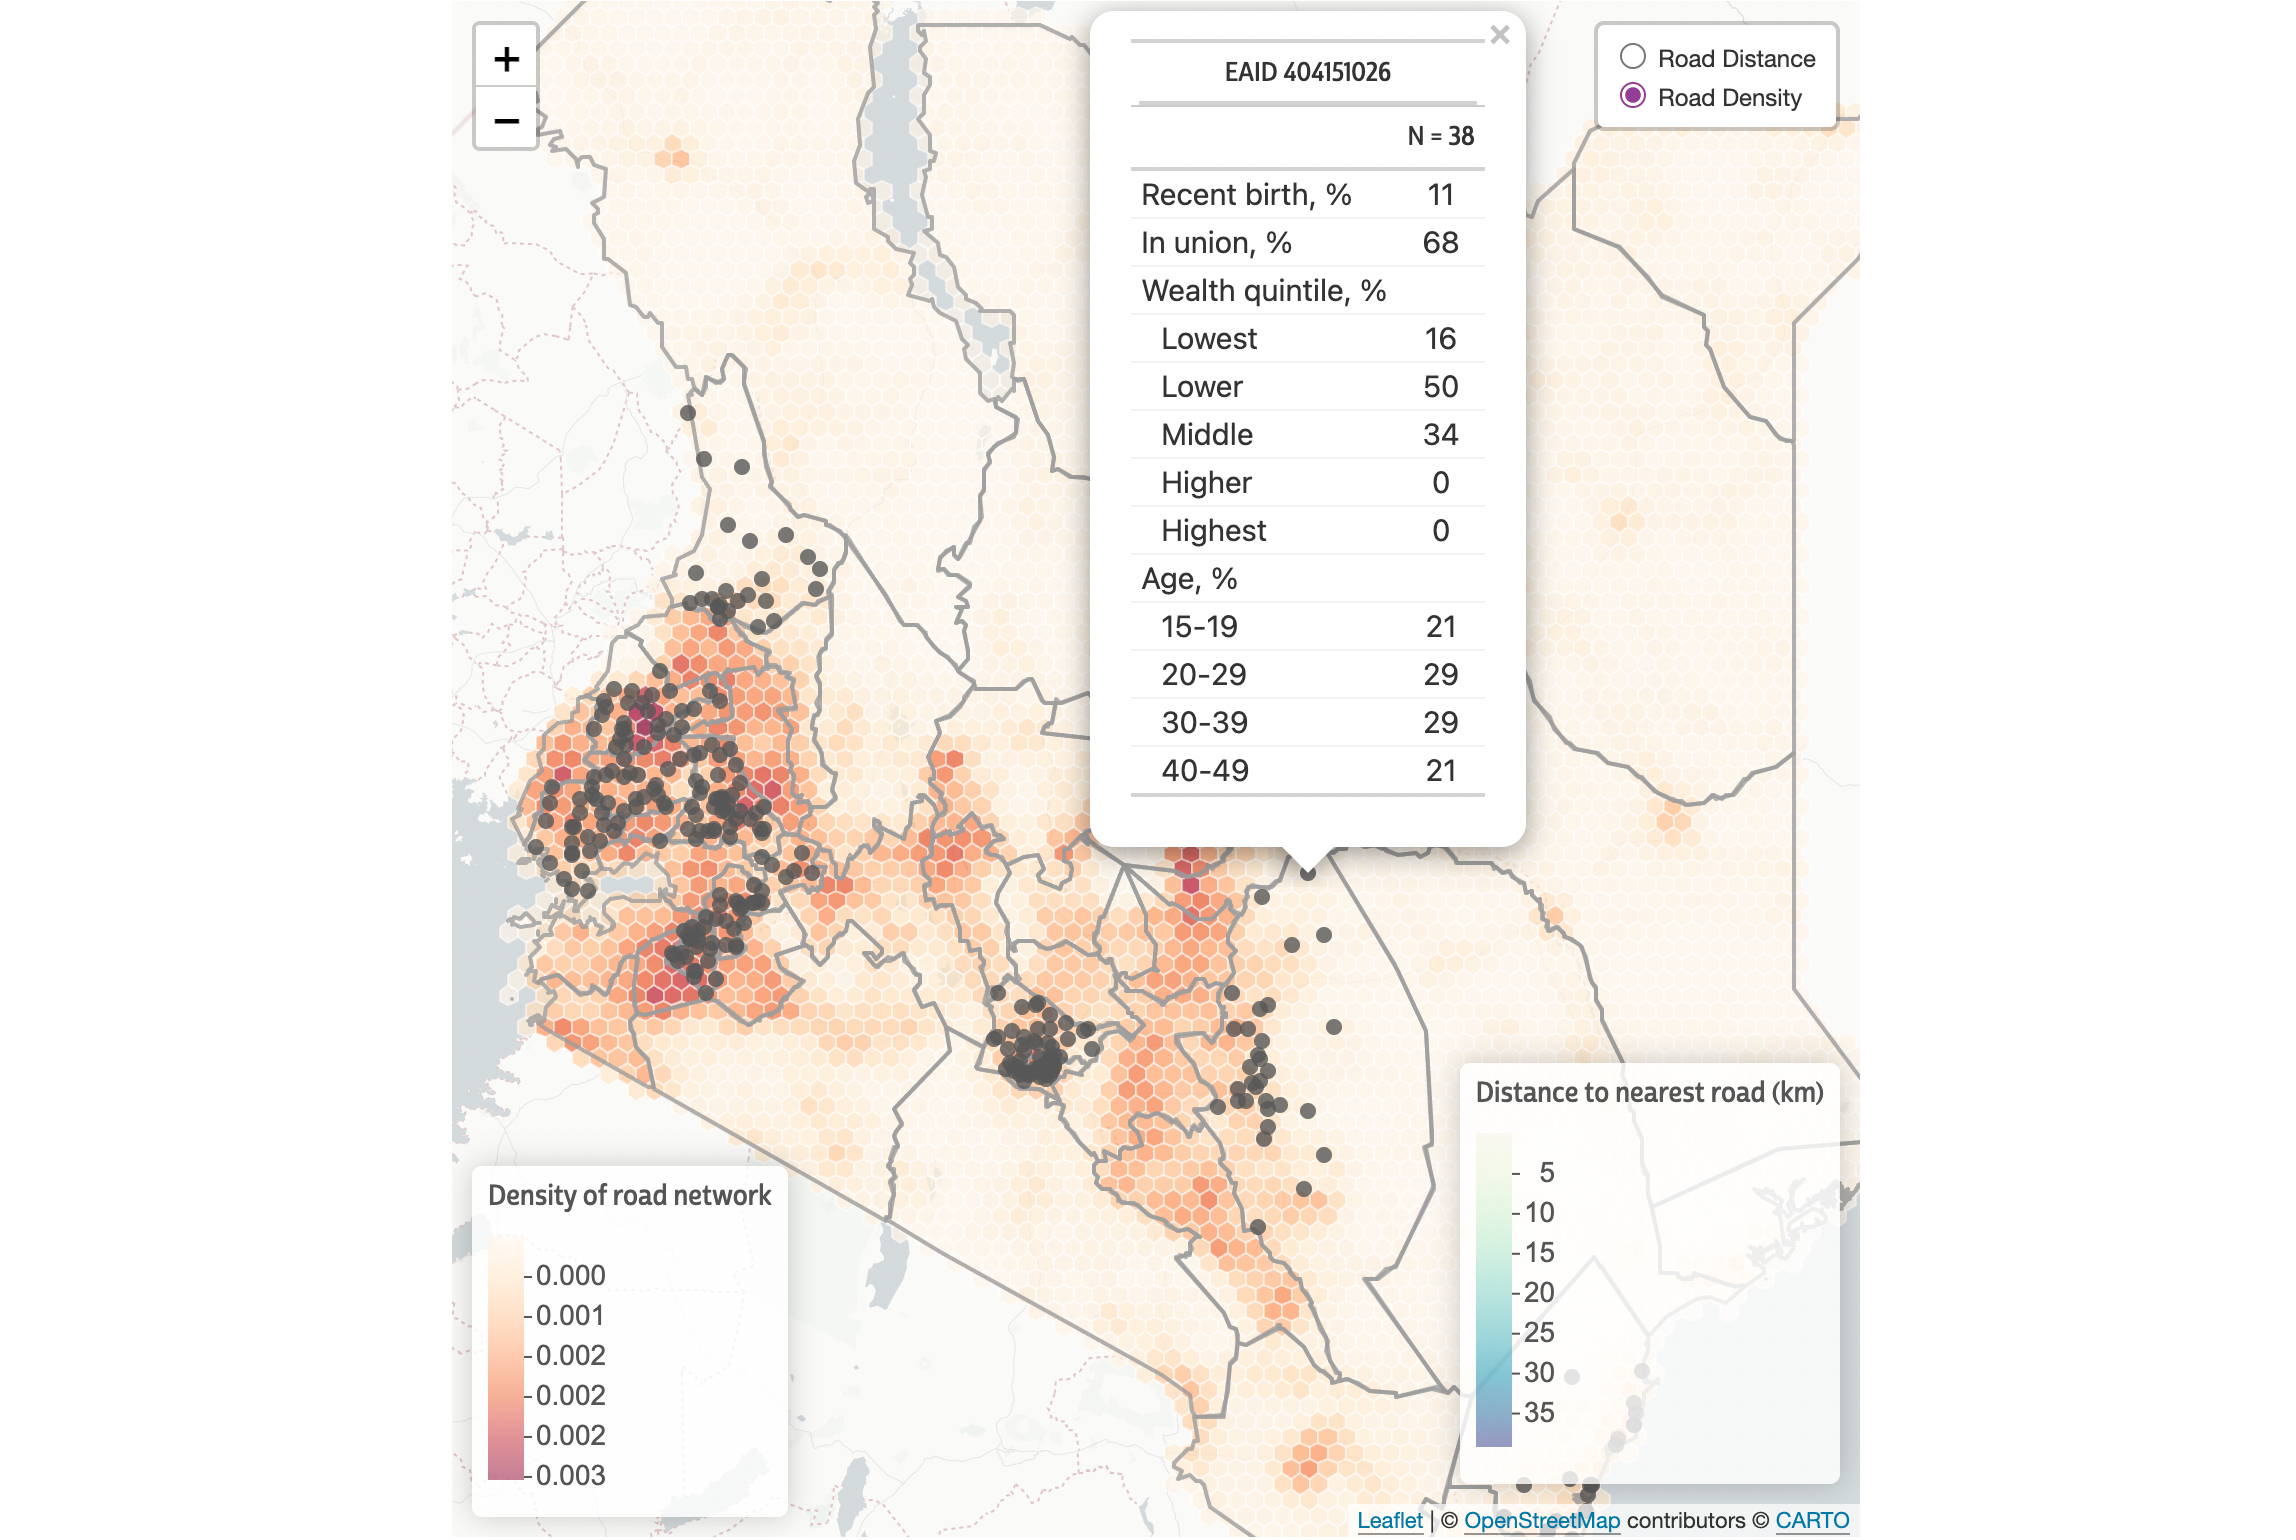
Data Exploration with Leaflet
Using interactive maps for exploratory data analysis with PMA GPS data
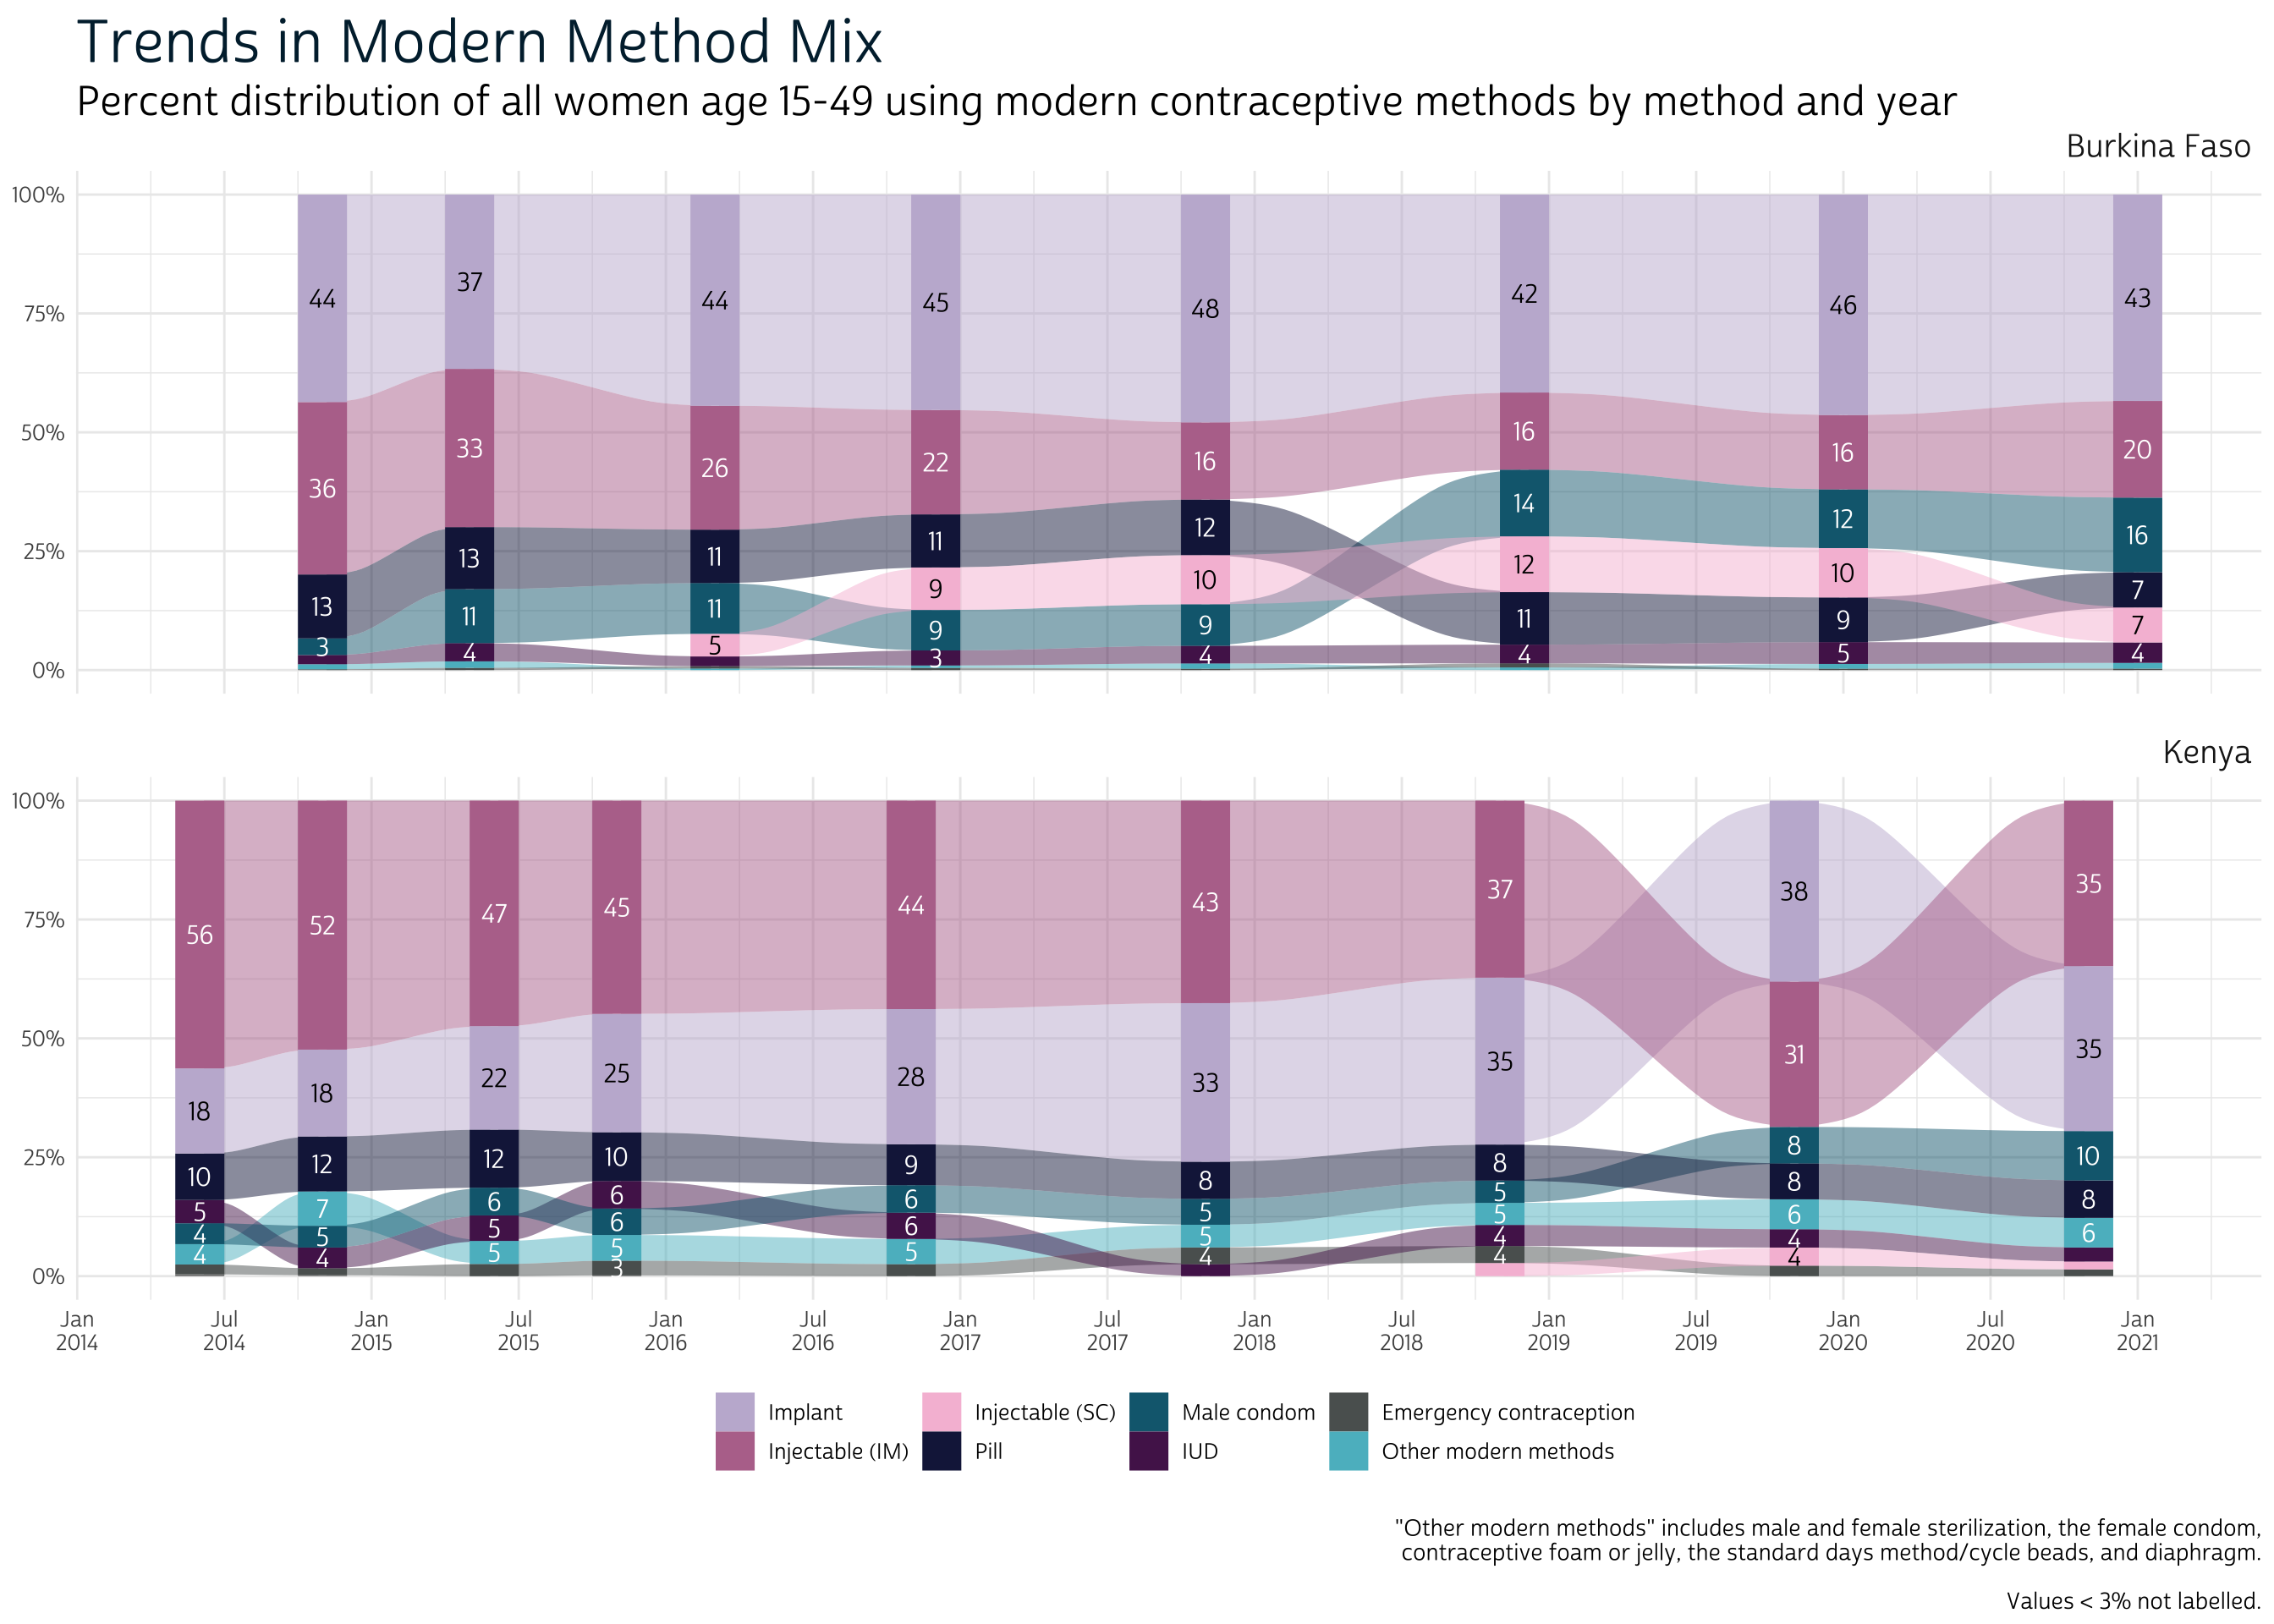
Trends in Modern Contraceptive Method Mix
Which methods are have gained popularity among modern method users since 2014?
Translated Youtube Transcripts with R and Python
With help from an imported Python module, you can get an automatically generated transcript for any IPUMS PMA video tutorial in your preferred language. No Python experience necessary!
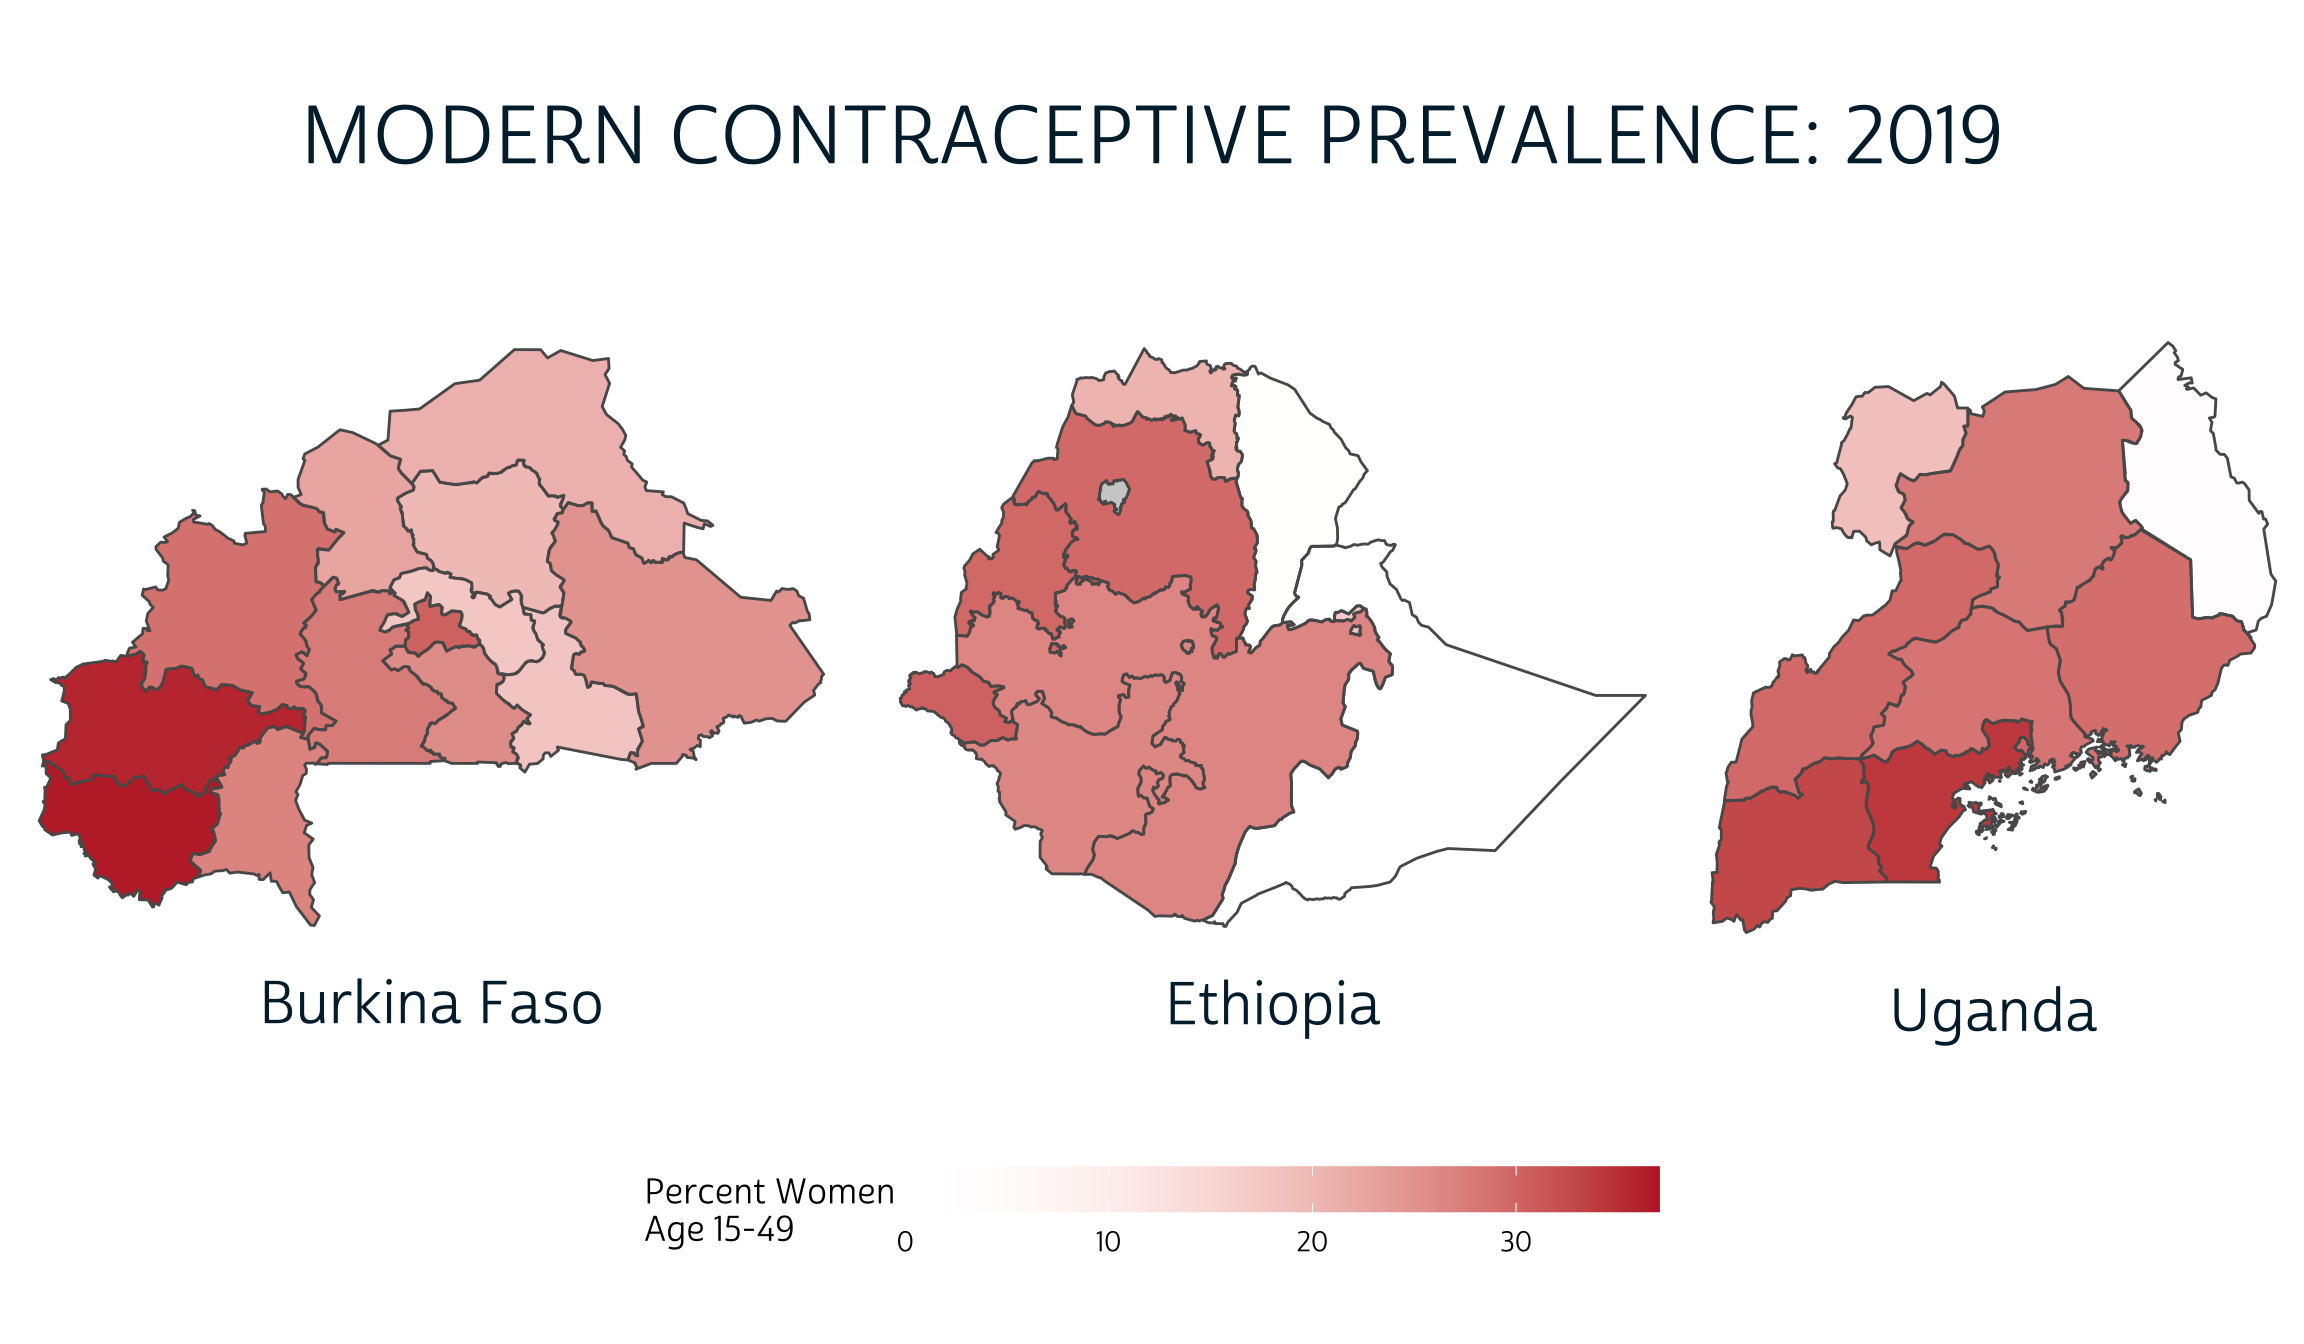
Arranging maps in a grid
Tools for creating spatial visualizations that compare change over time or differences between PMA countries.
Slide Presentations in R with Quarto
We've been preparing for an upcoming workshop by building our first presentation with Quarto and Revealjs. Here's what we've learned so far.

Webinar: Did COVID-19 Impact Contraceptive Use?
Breakout sessions for both R and Stata users show how to use panel data from IPUMS PMA to model contraceptive adoption and discontinuation during the first year of the pandemic.

Introducing Longitudinal Service Delivery Point Data
A new feature makes it easy to locate facilities surveyed in multiple rounds of SDP data collection. Plus, new Client Exit Interview data are now available!
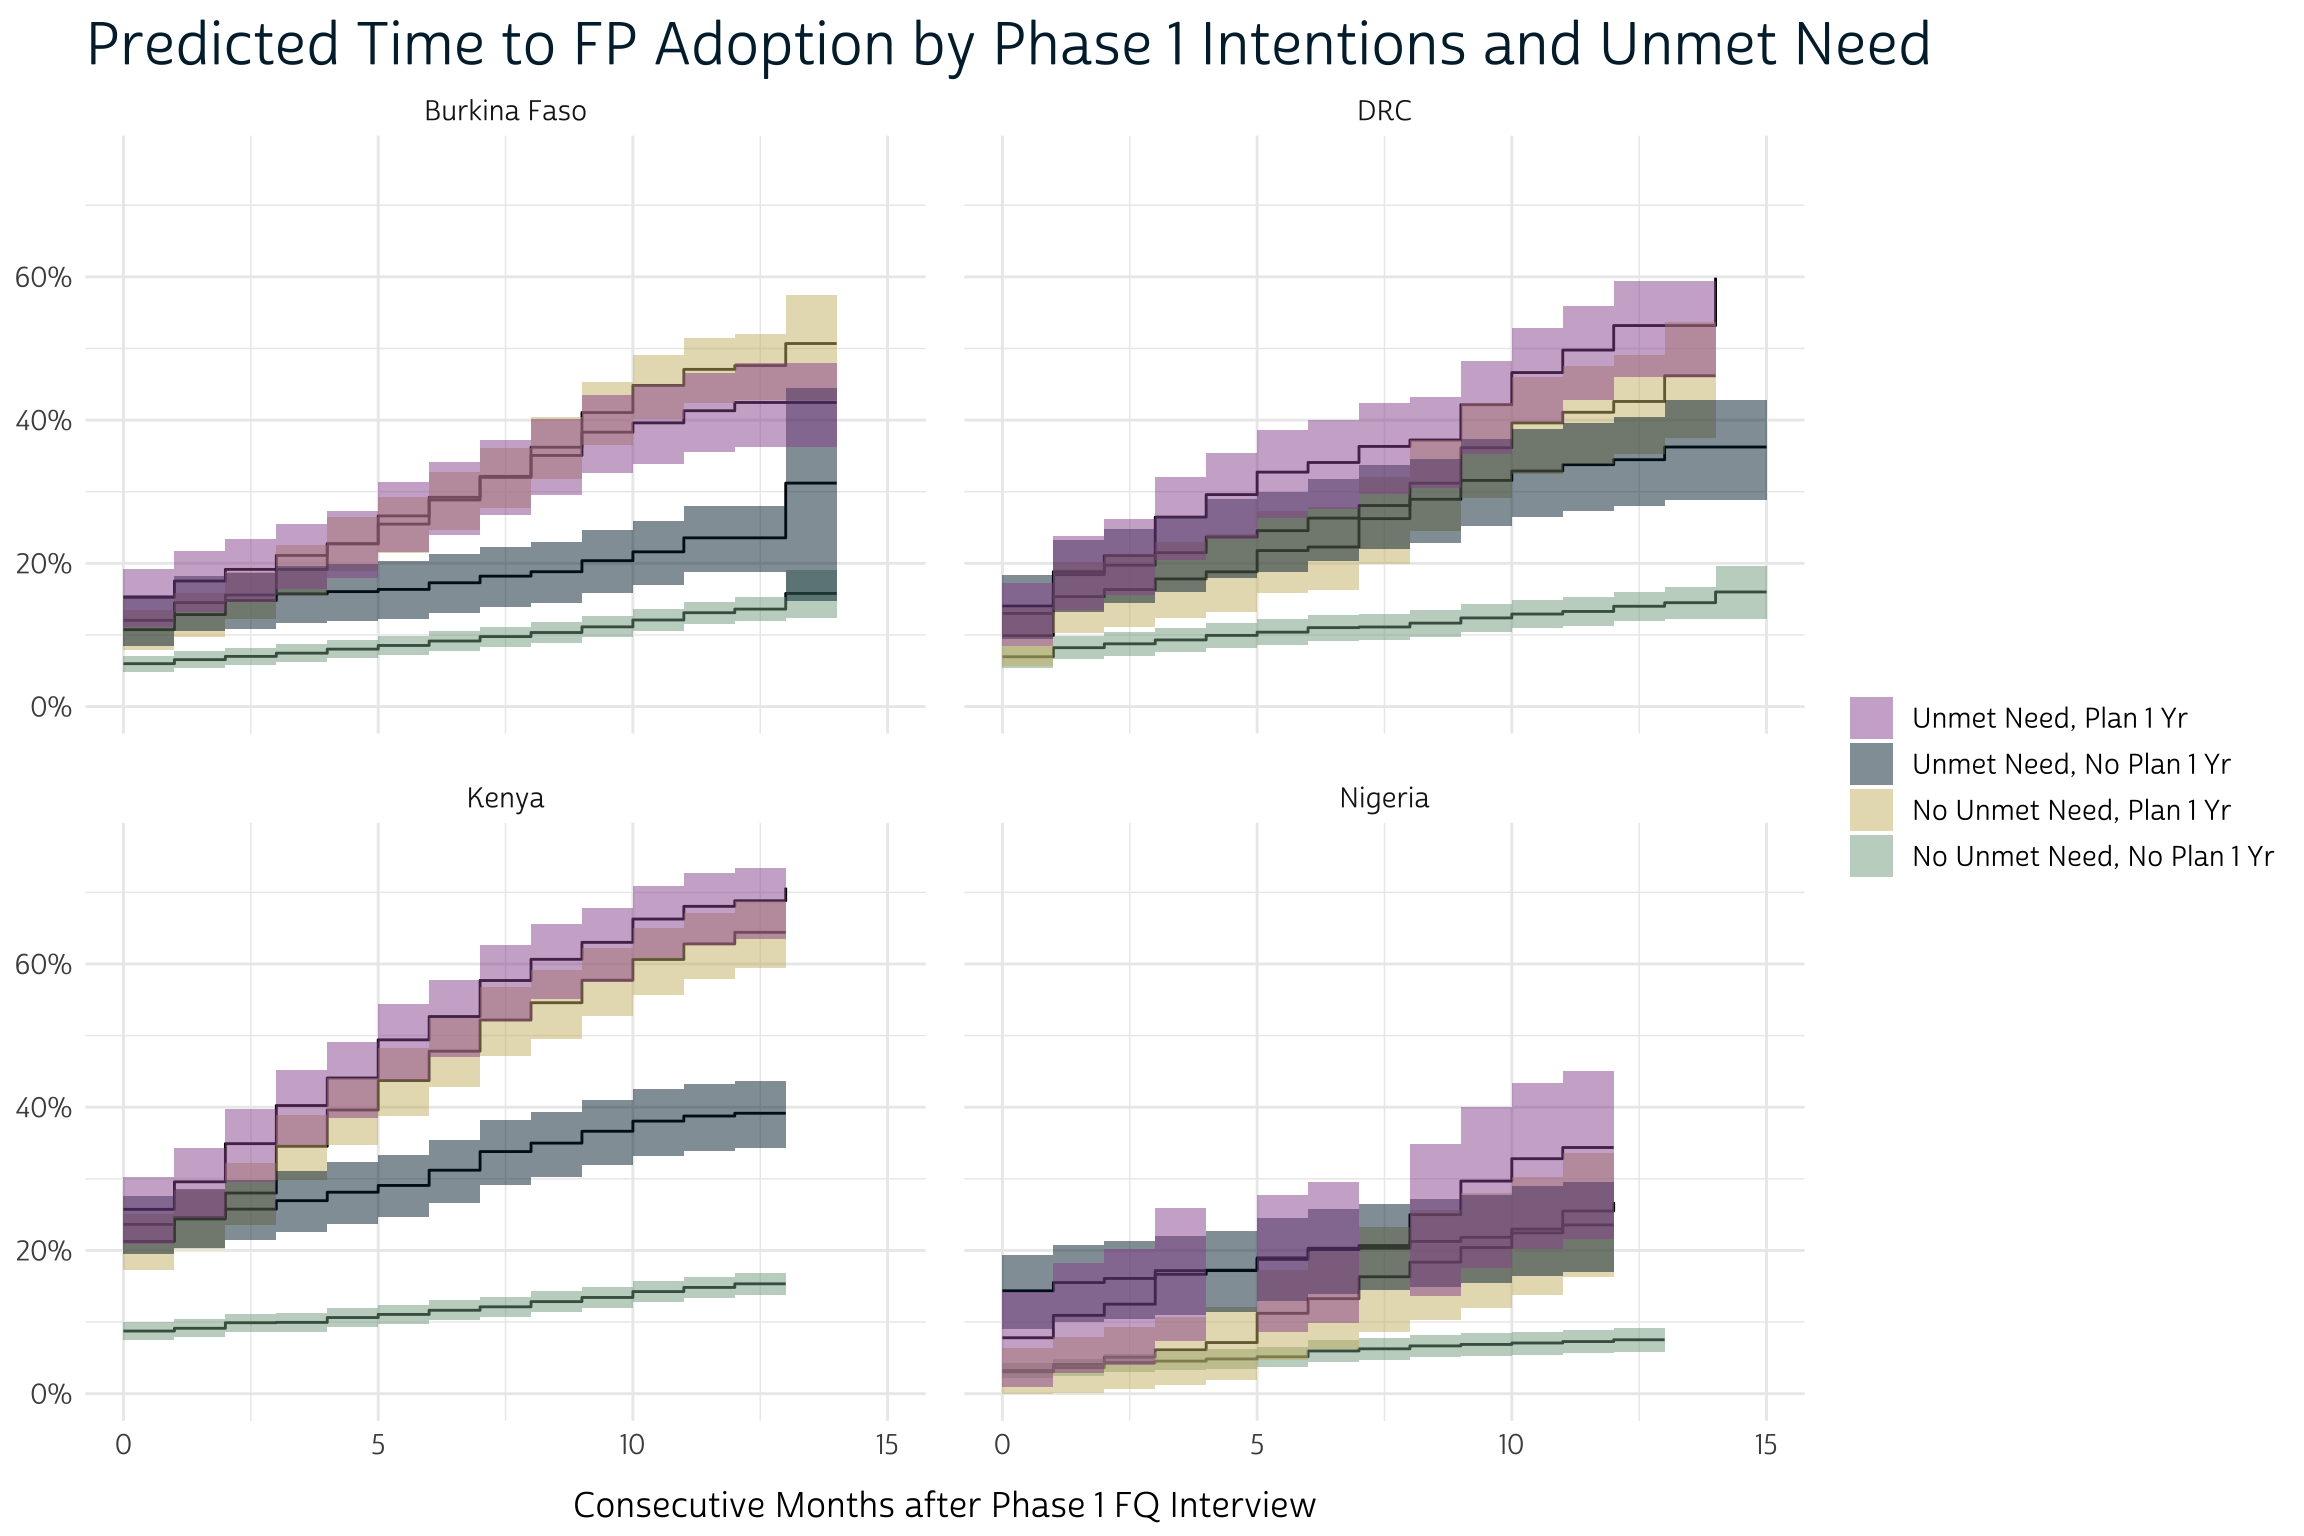
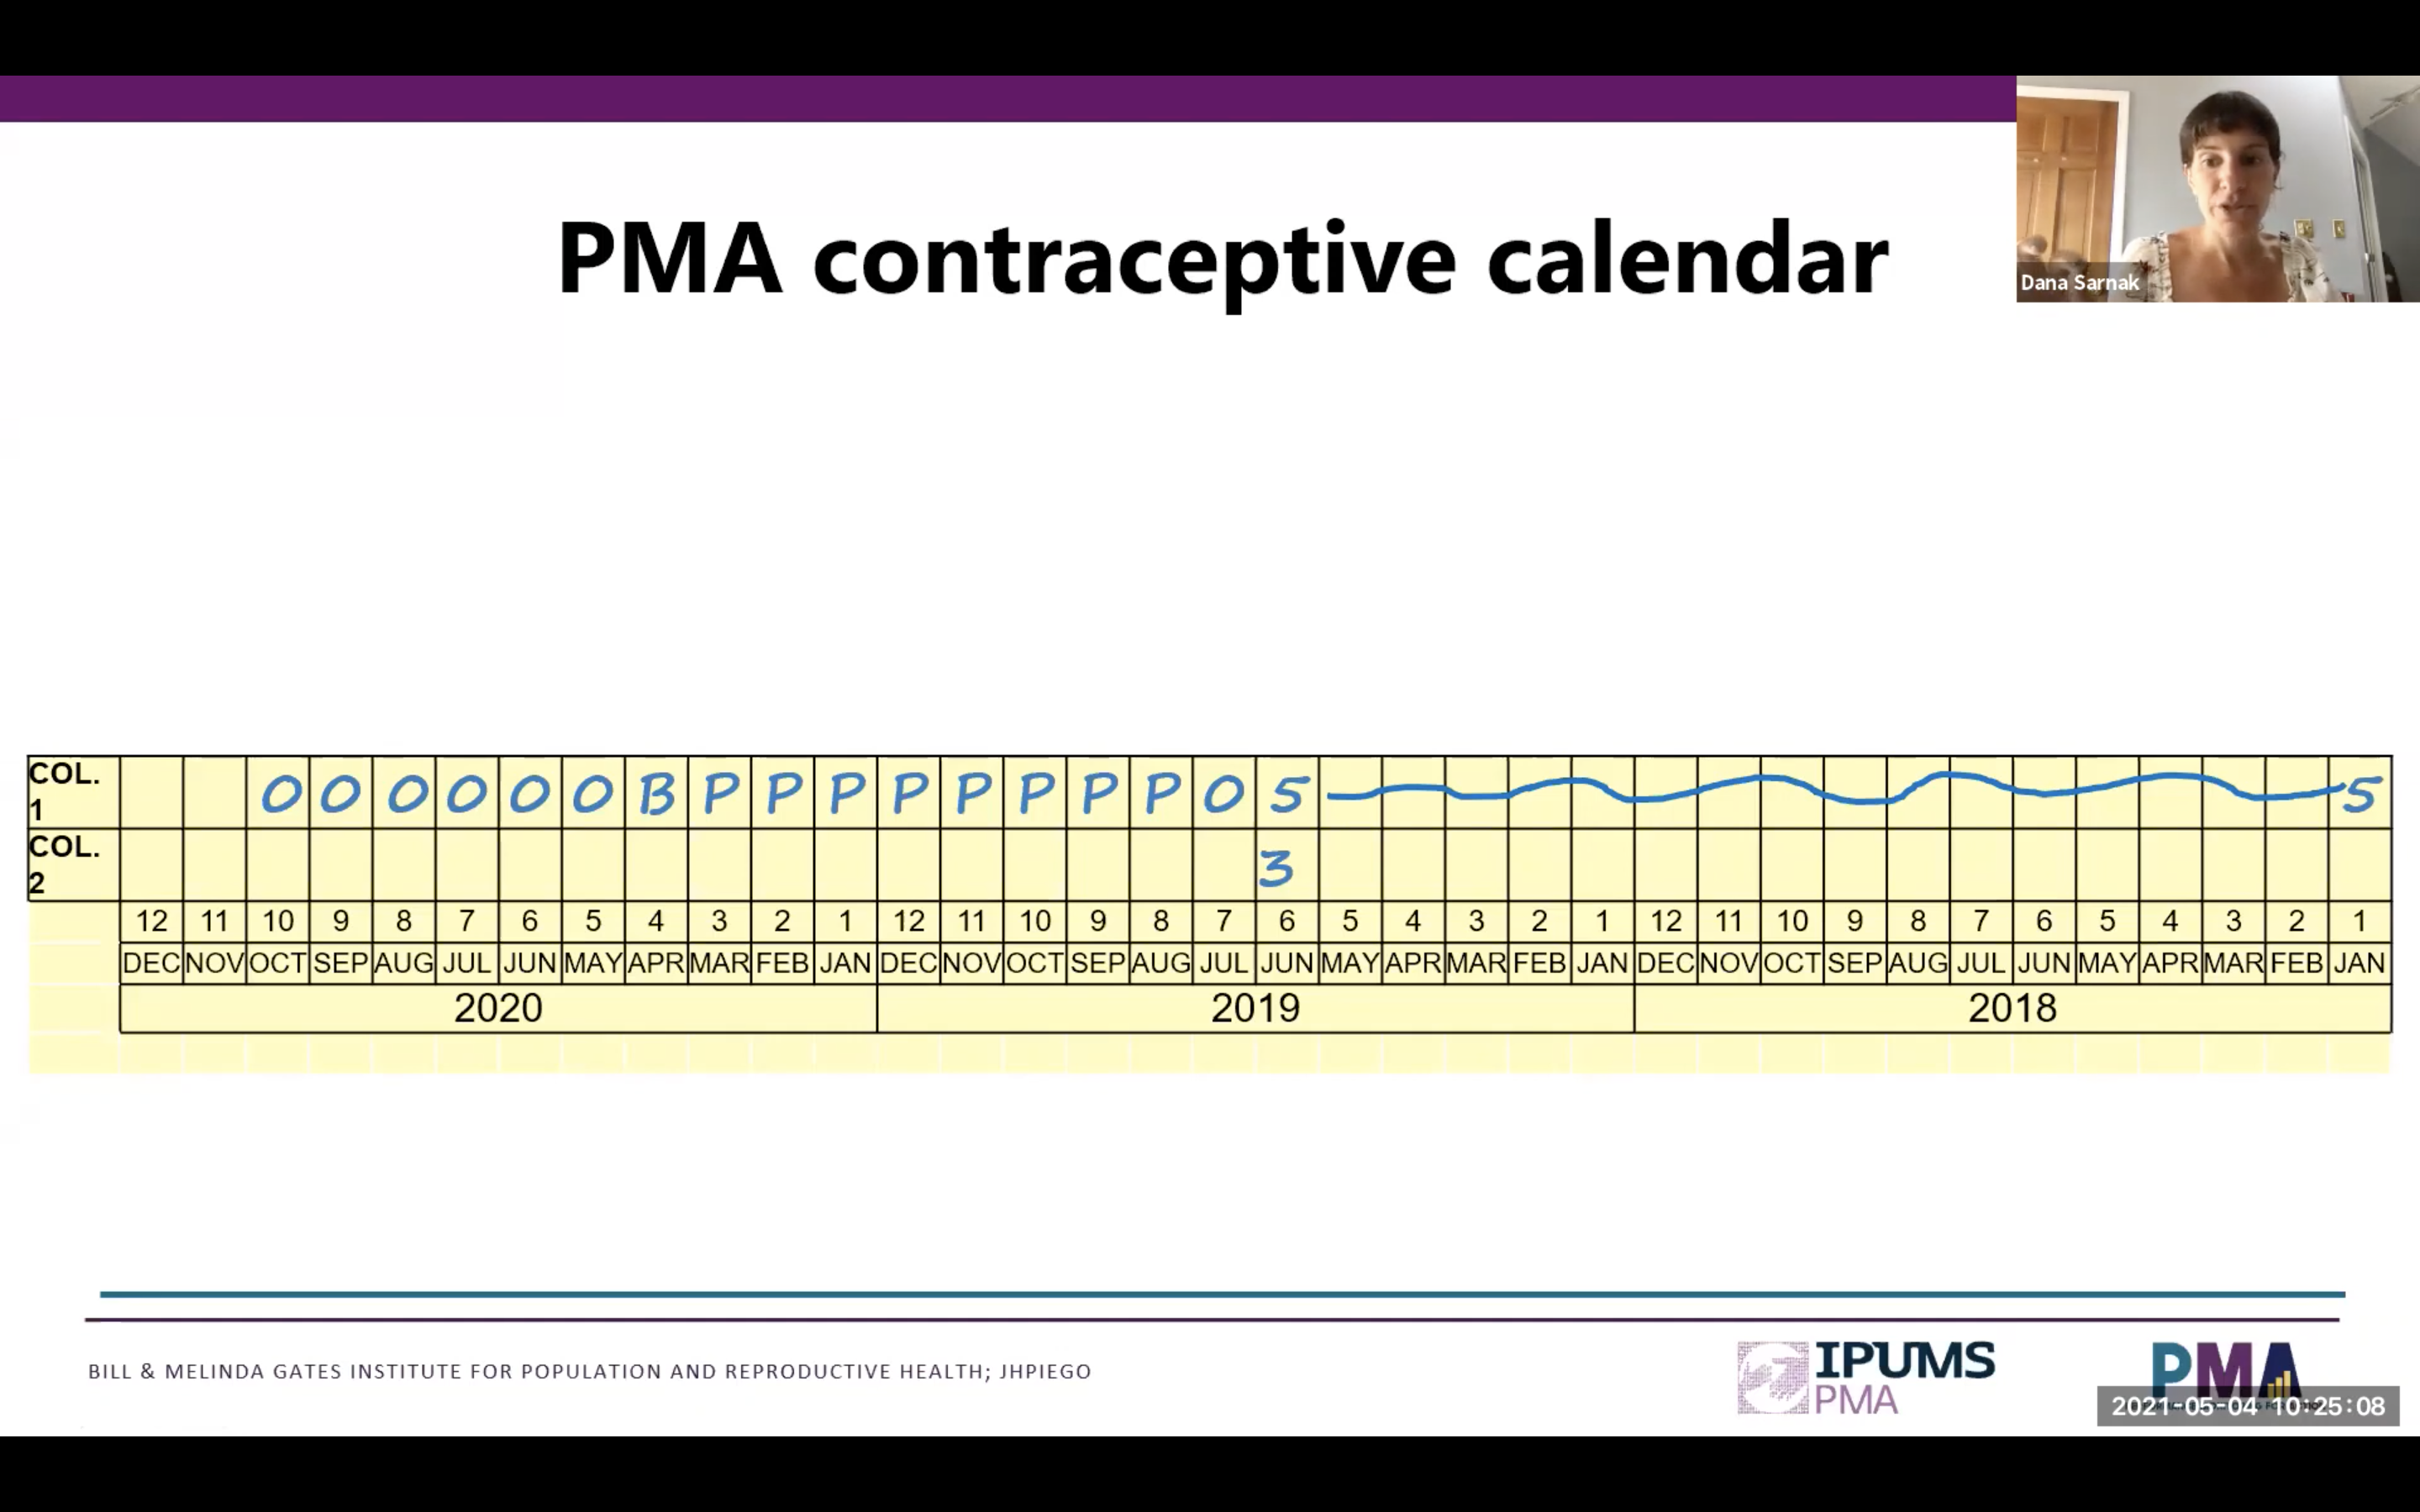
Contraceptive Calendar Data in PMA Panel Surveys
PMA panel members report their contraceptive use, reasons for discontinuation, and pregnancy status for each month leading up to the Female Questionnaire. Here's how to get up and running with your first Time-to-Event analysis.
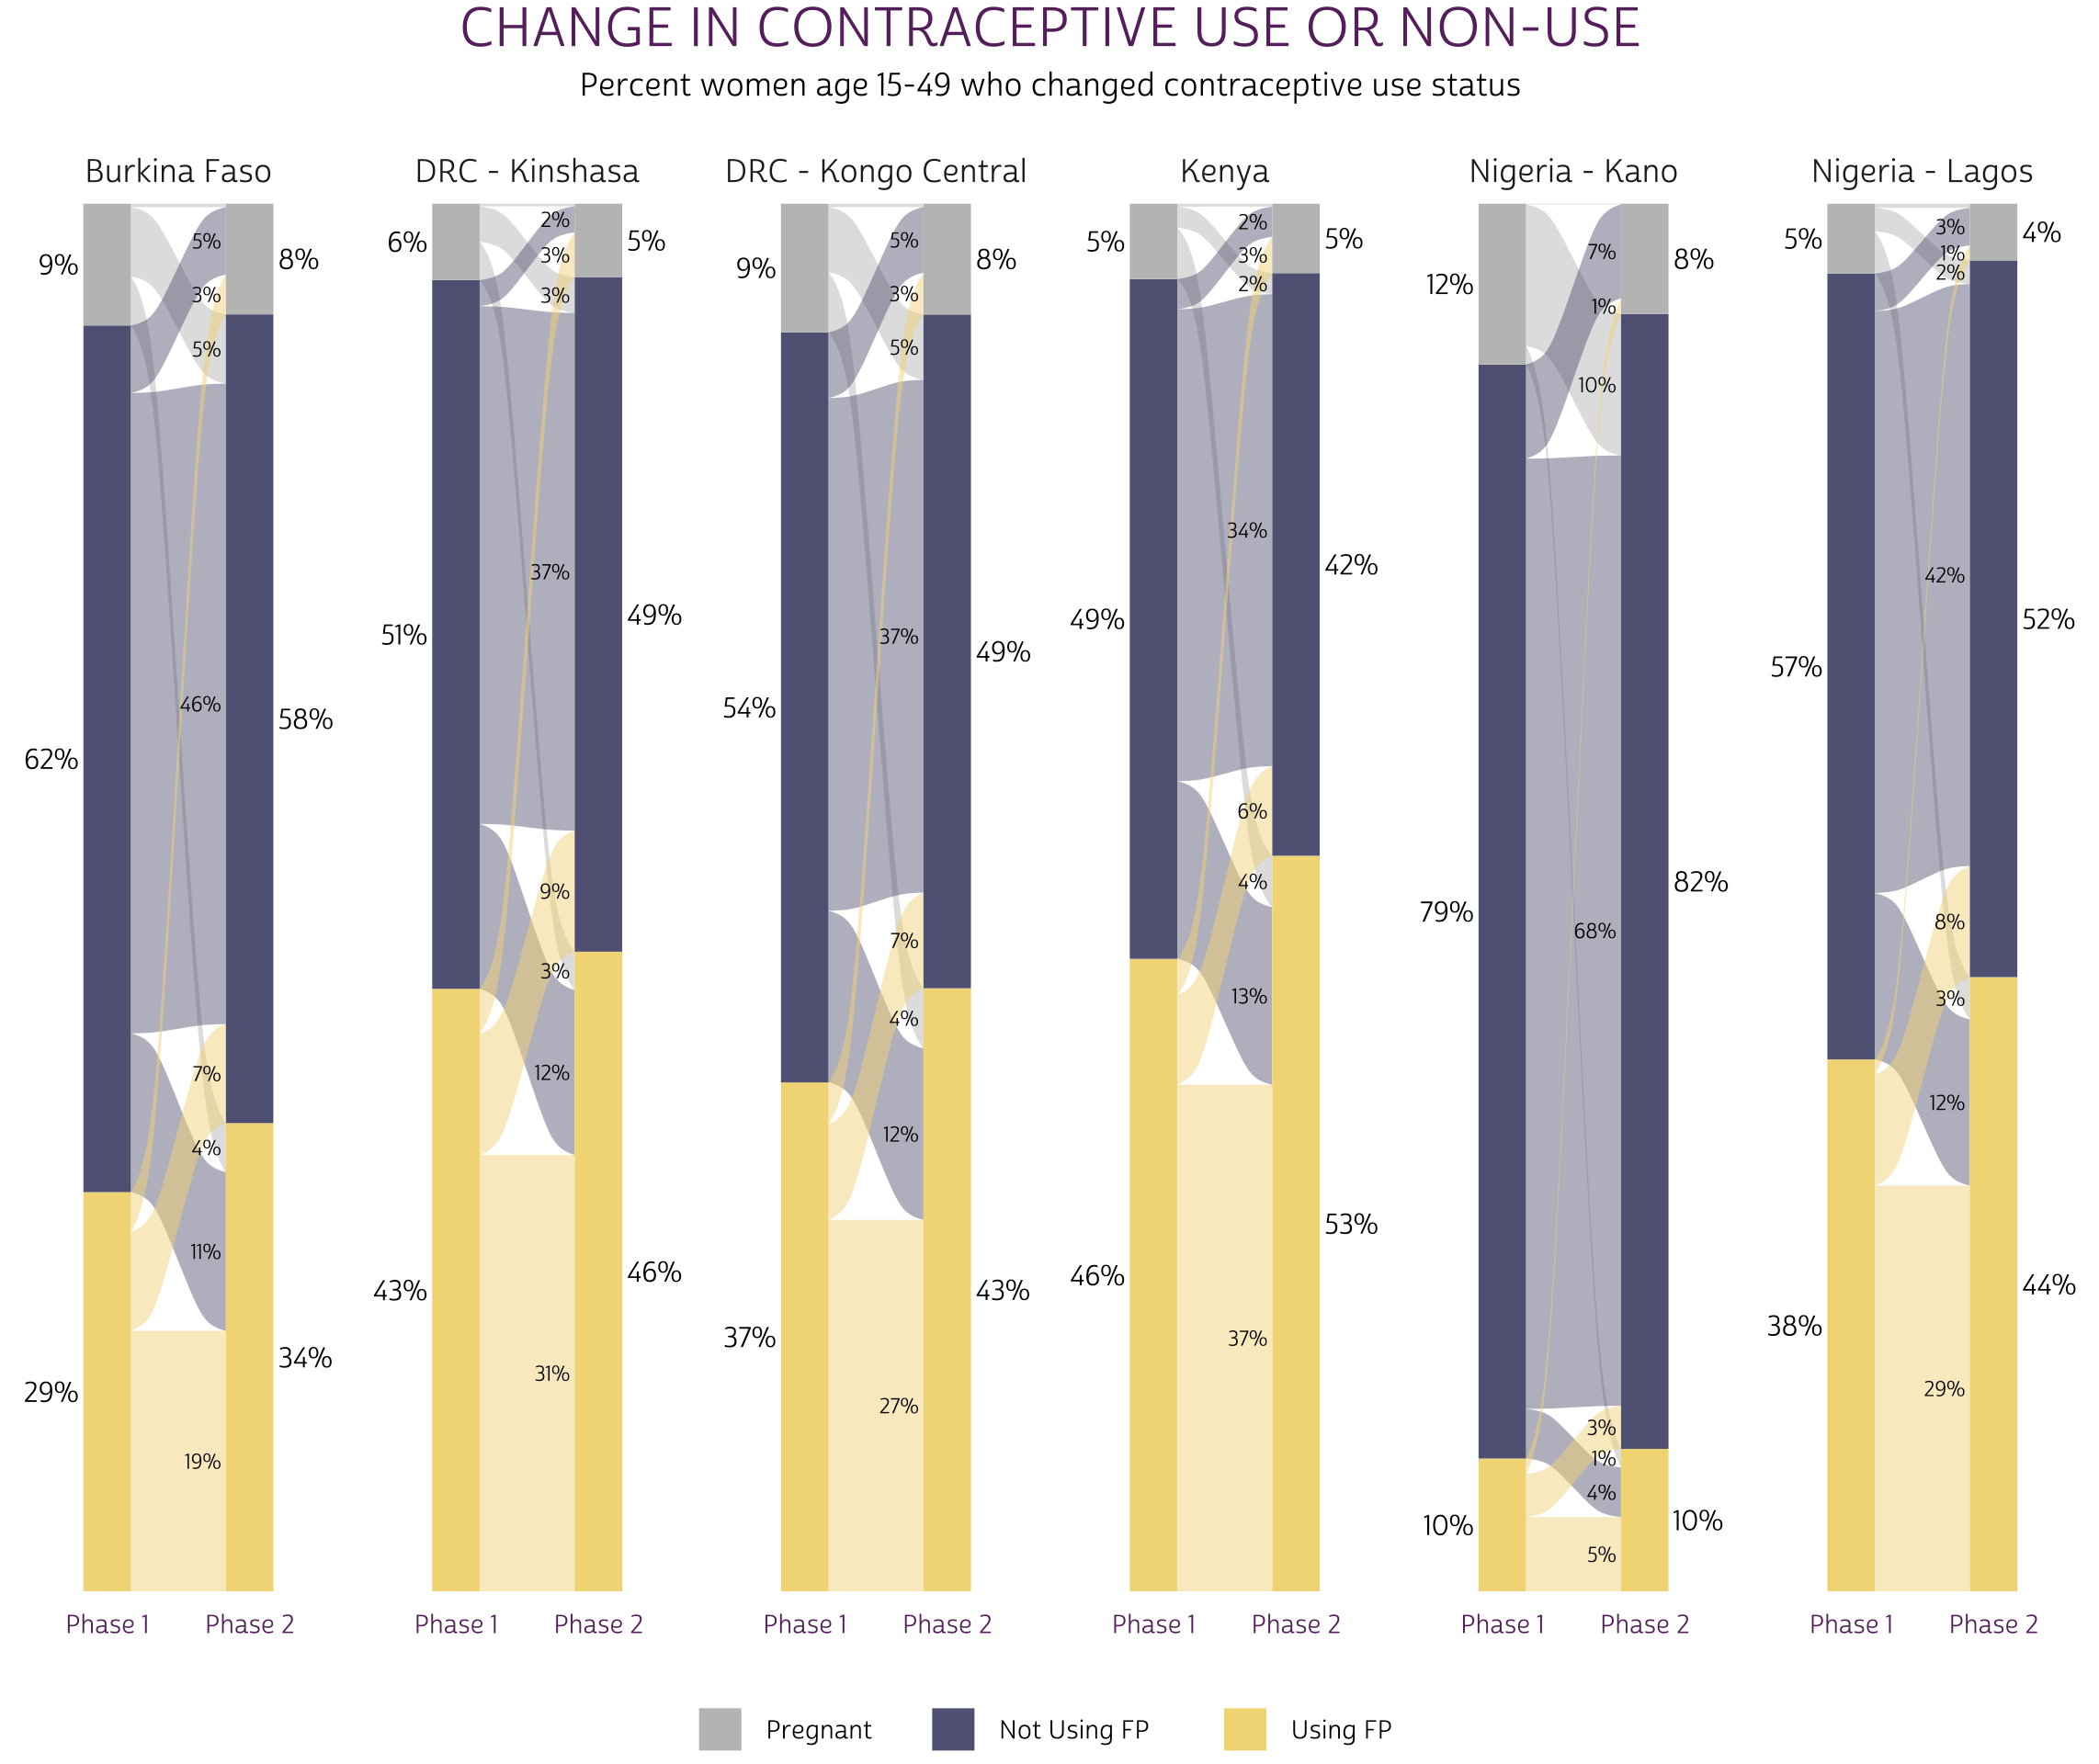
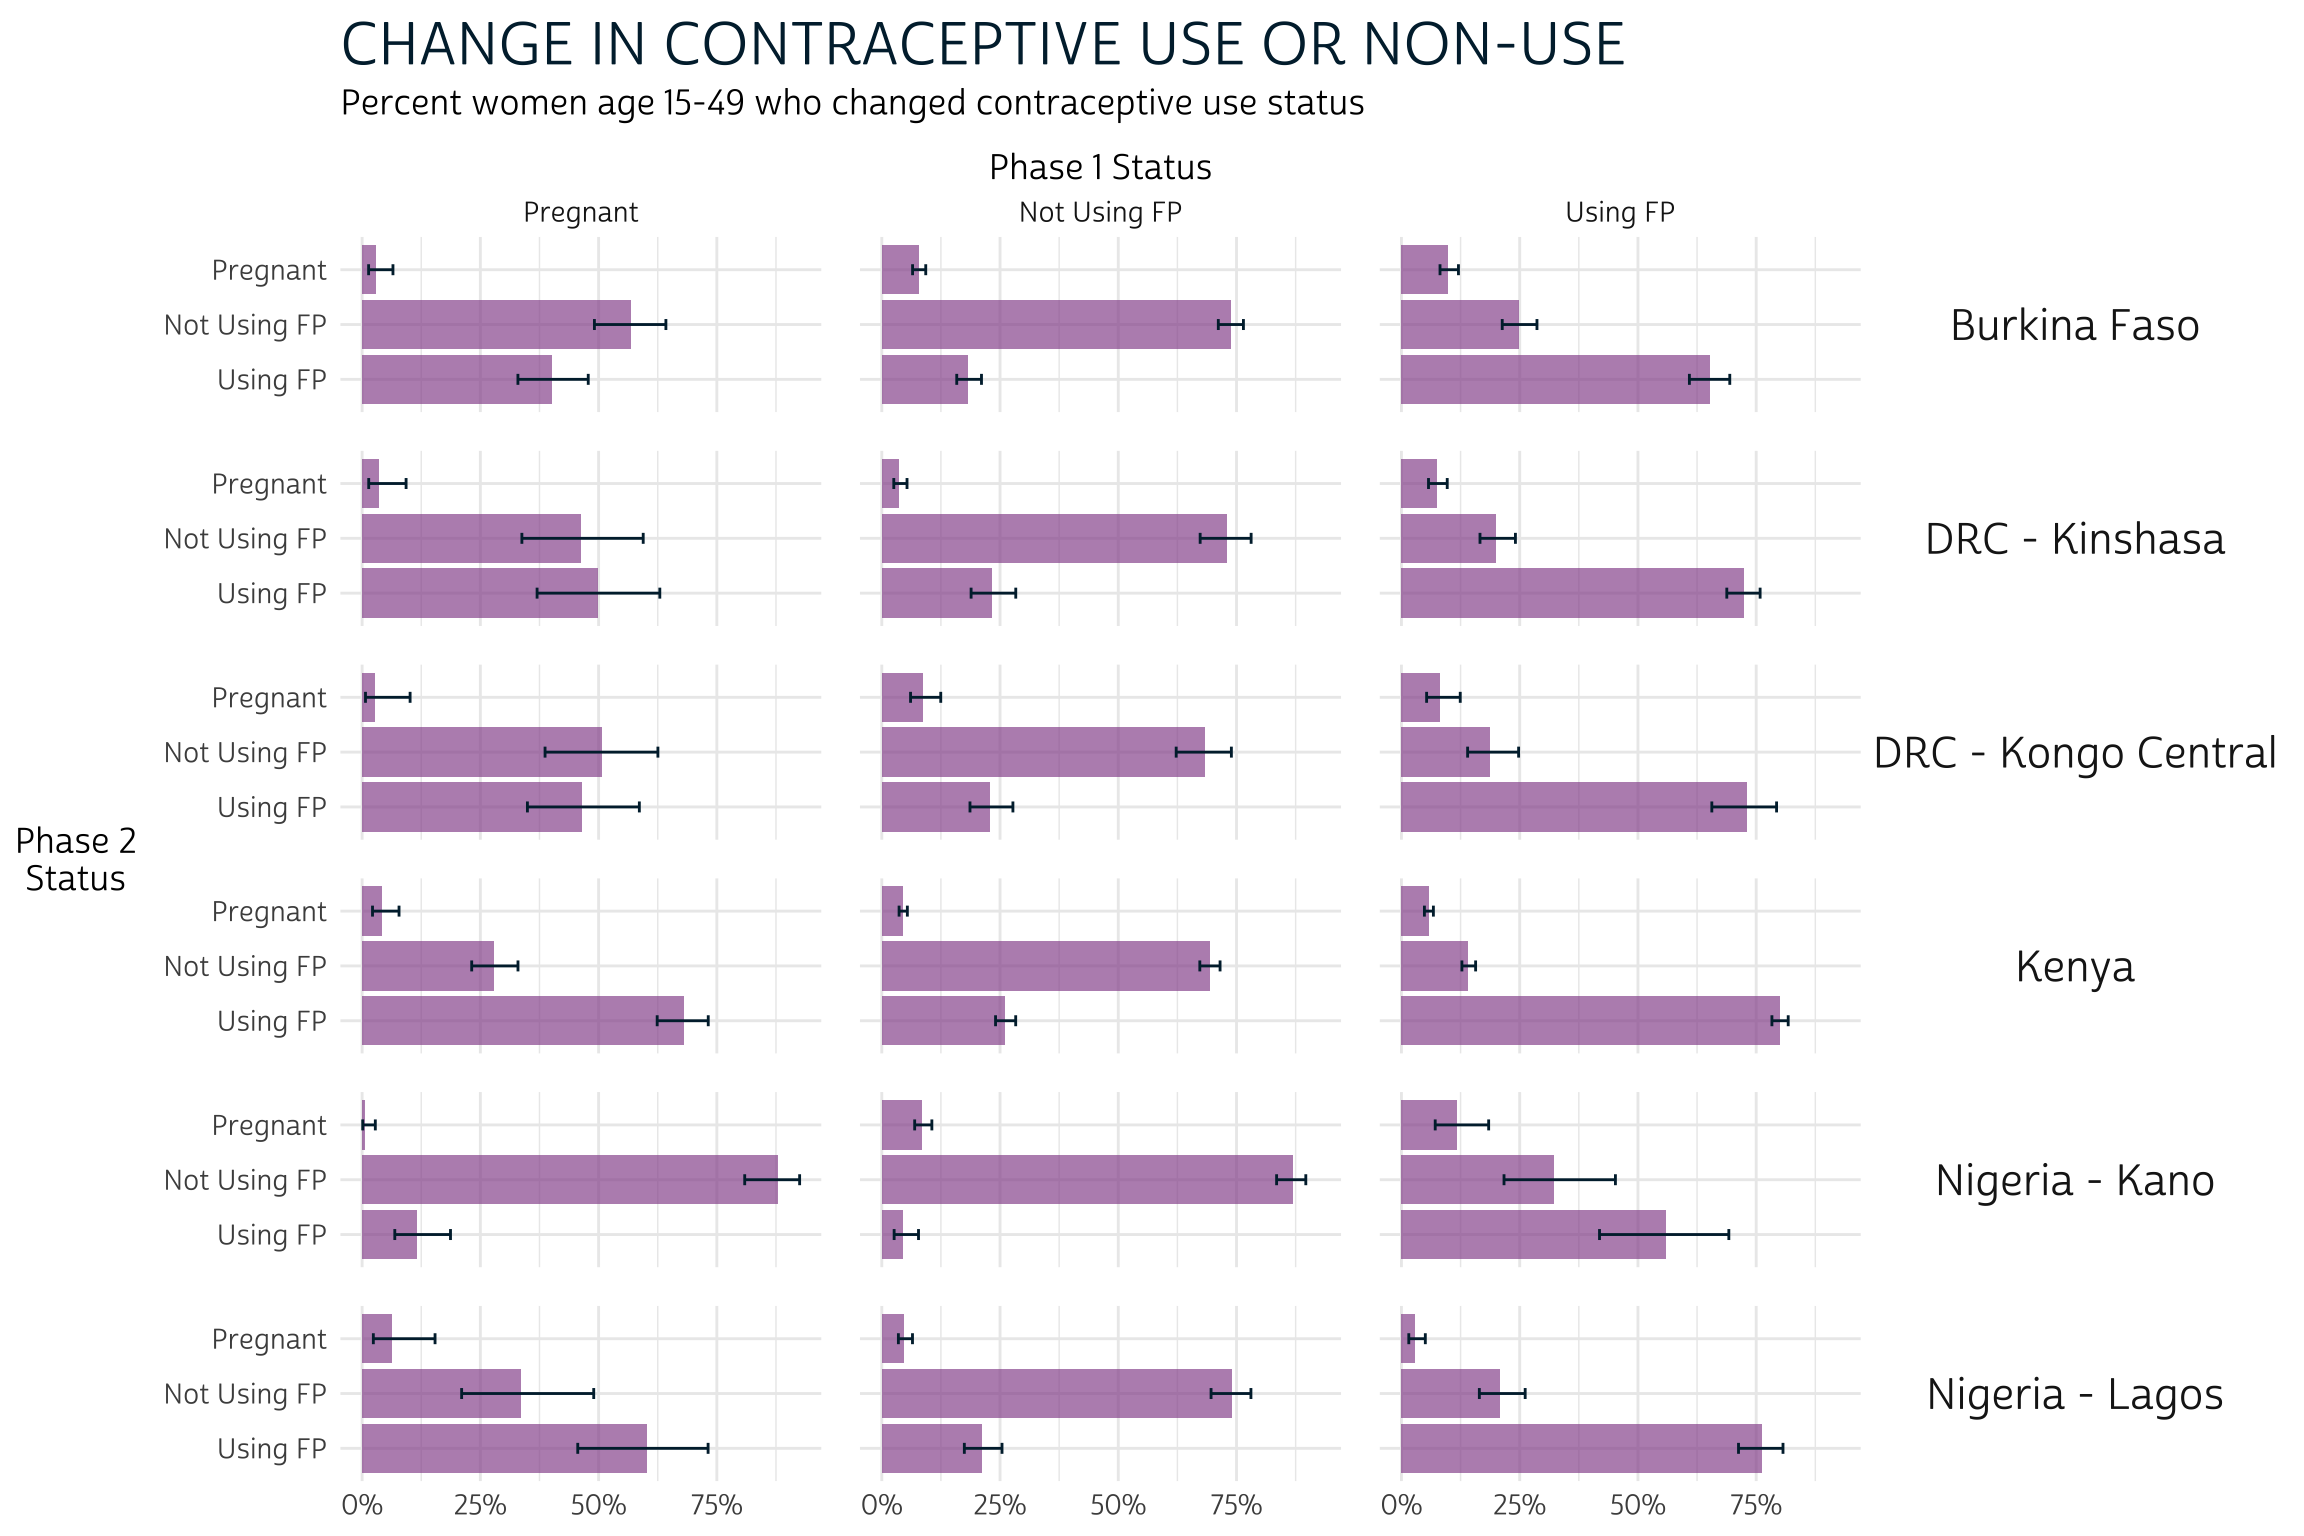
Data Visualization Toolkit for PMA Panel Data
Heatmaps and alluvial plots make it easy to compare key family planning indicators over time and across multiple populations sampled by PMA panel surveys.
Calculating Key Indicators for Family Planning Panel Data
We show how to reproduce measures featured in PMA panel reports, and how to visualize significant differences between groups in figures built with ggplot2.
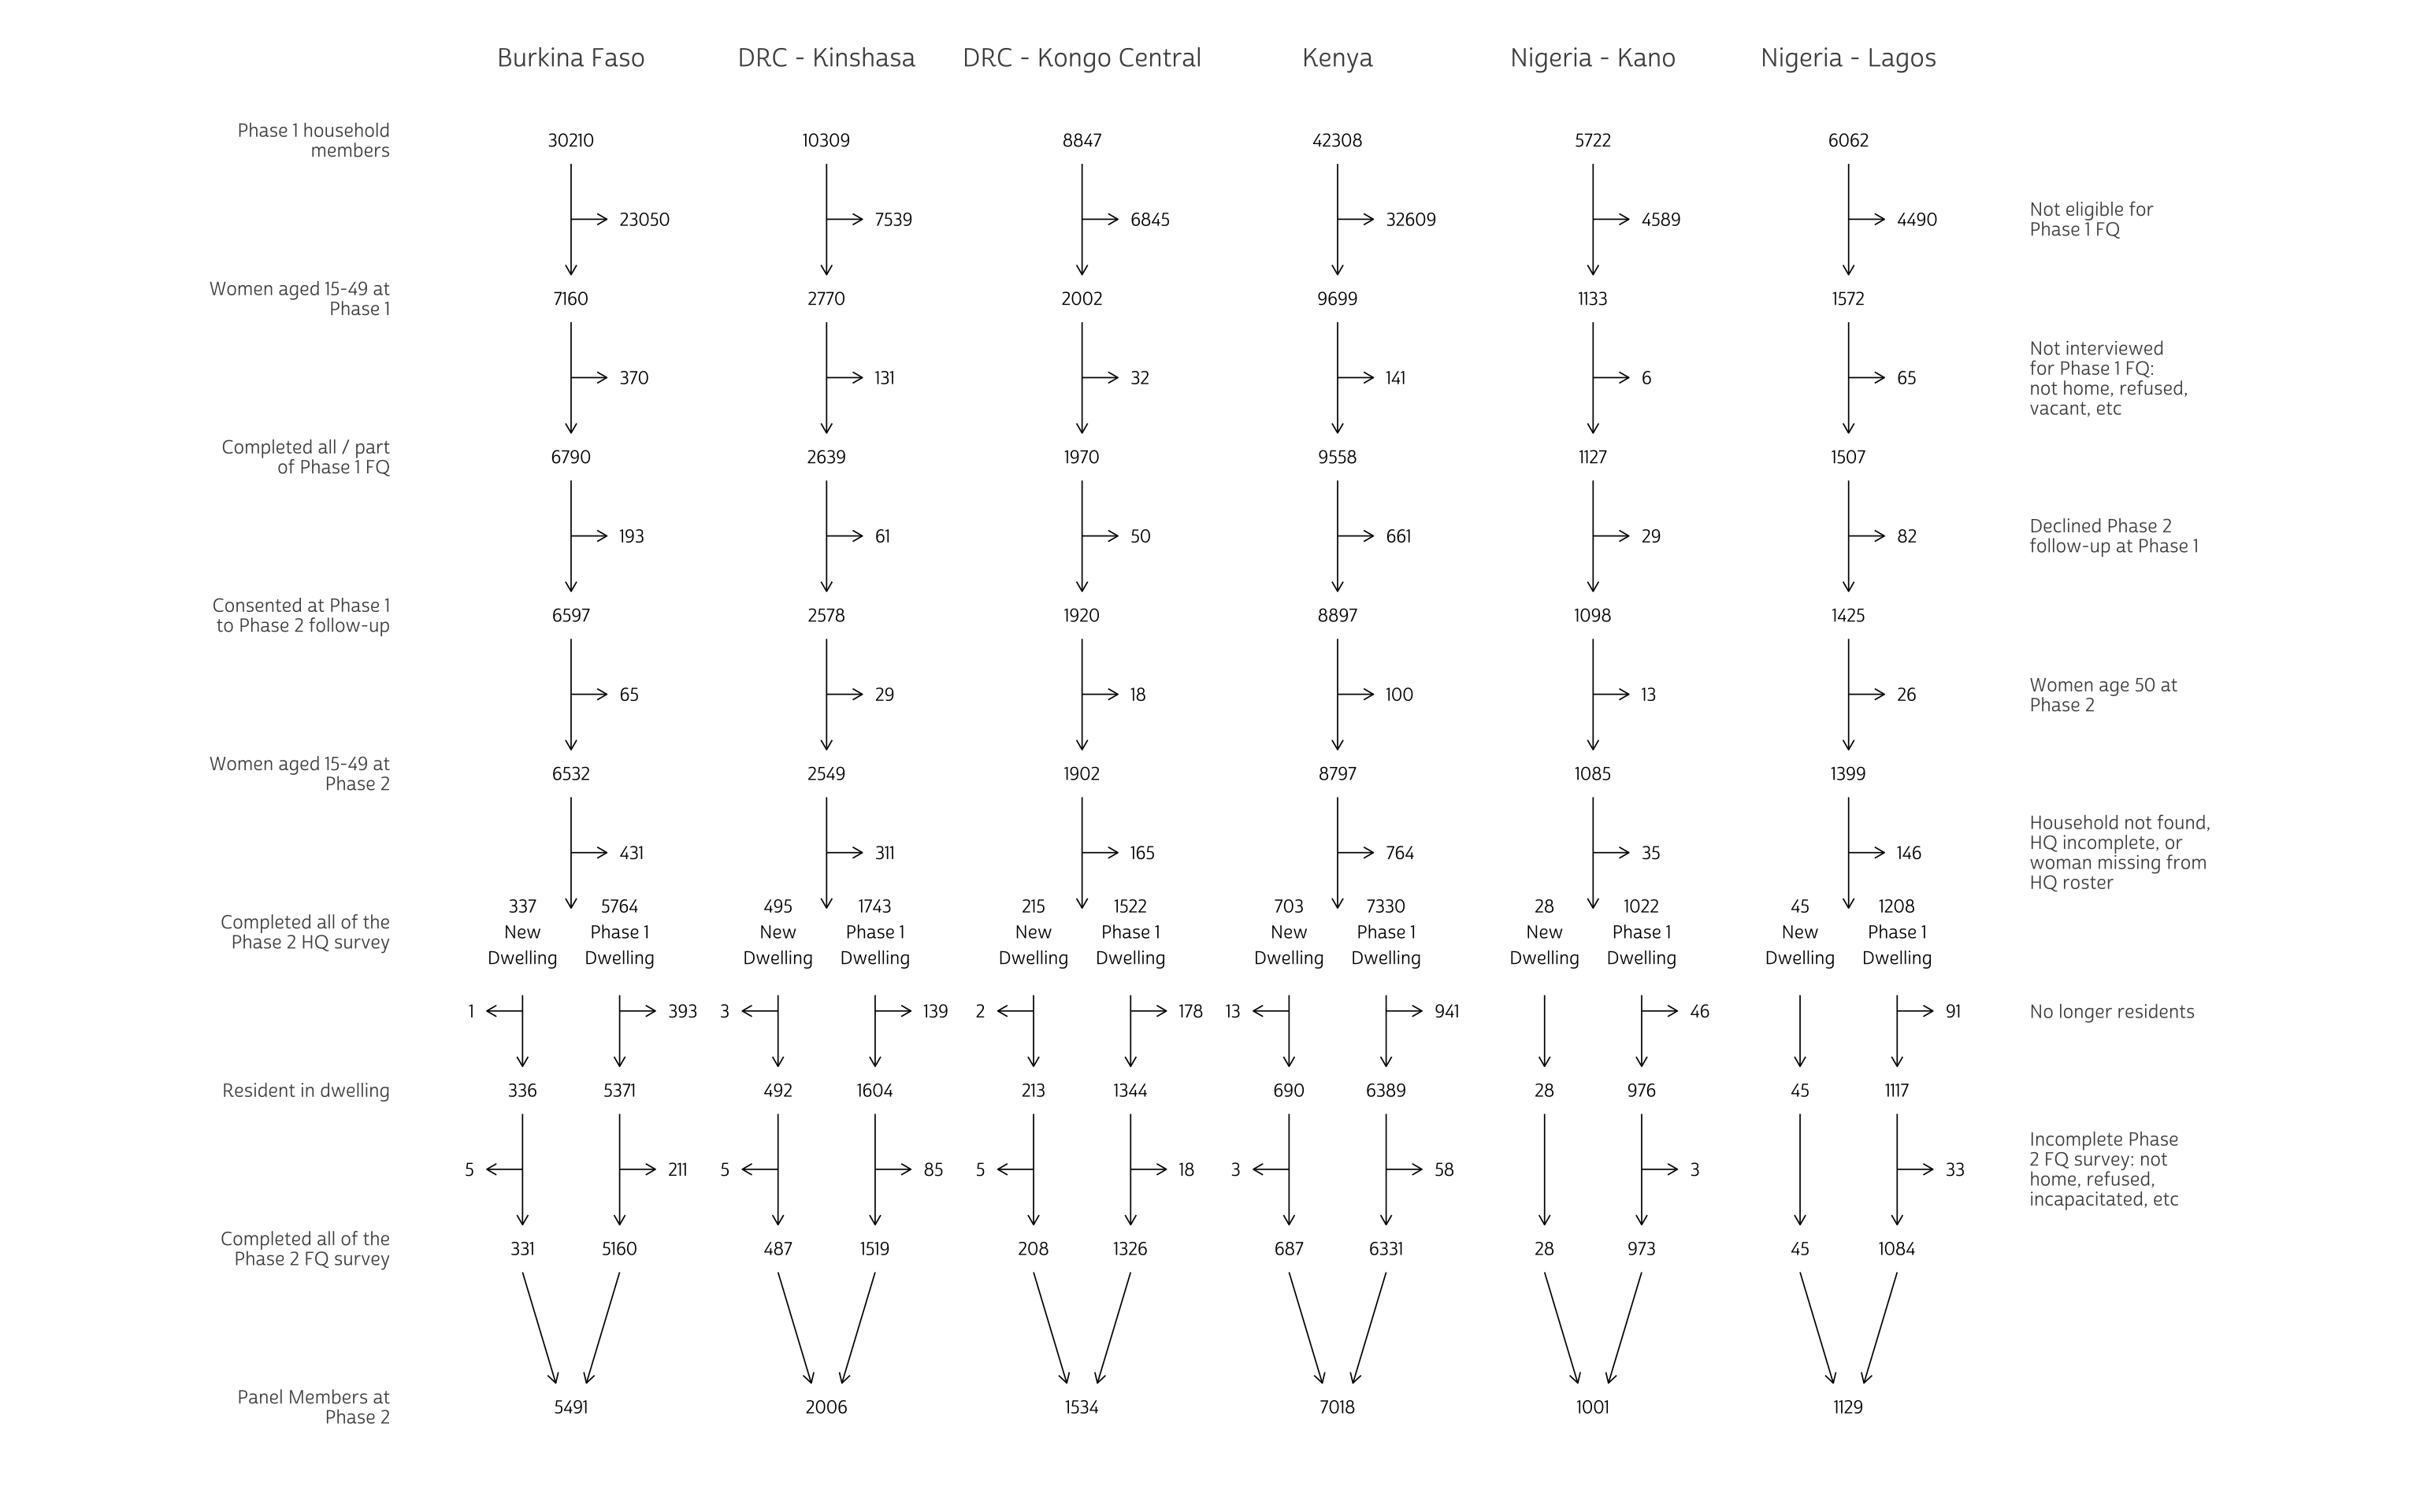
Visualizing Panel Membership
Your guide to inclusion criteria, loss to follow-up, and key technical variables for Family Planning panel data from IPUMS PMA.
Longitudinal Data Extracts
Getting started with new "long" and "wide" data formats in R.

Family Planning Panel Data Now Available from IPUMS PMA
This month's data release includes Phase 2 panel data from 6 samples, plus Phase 1 panel data from 3 new countries.
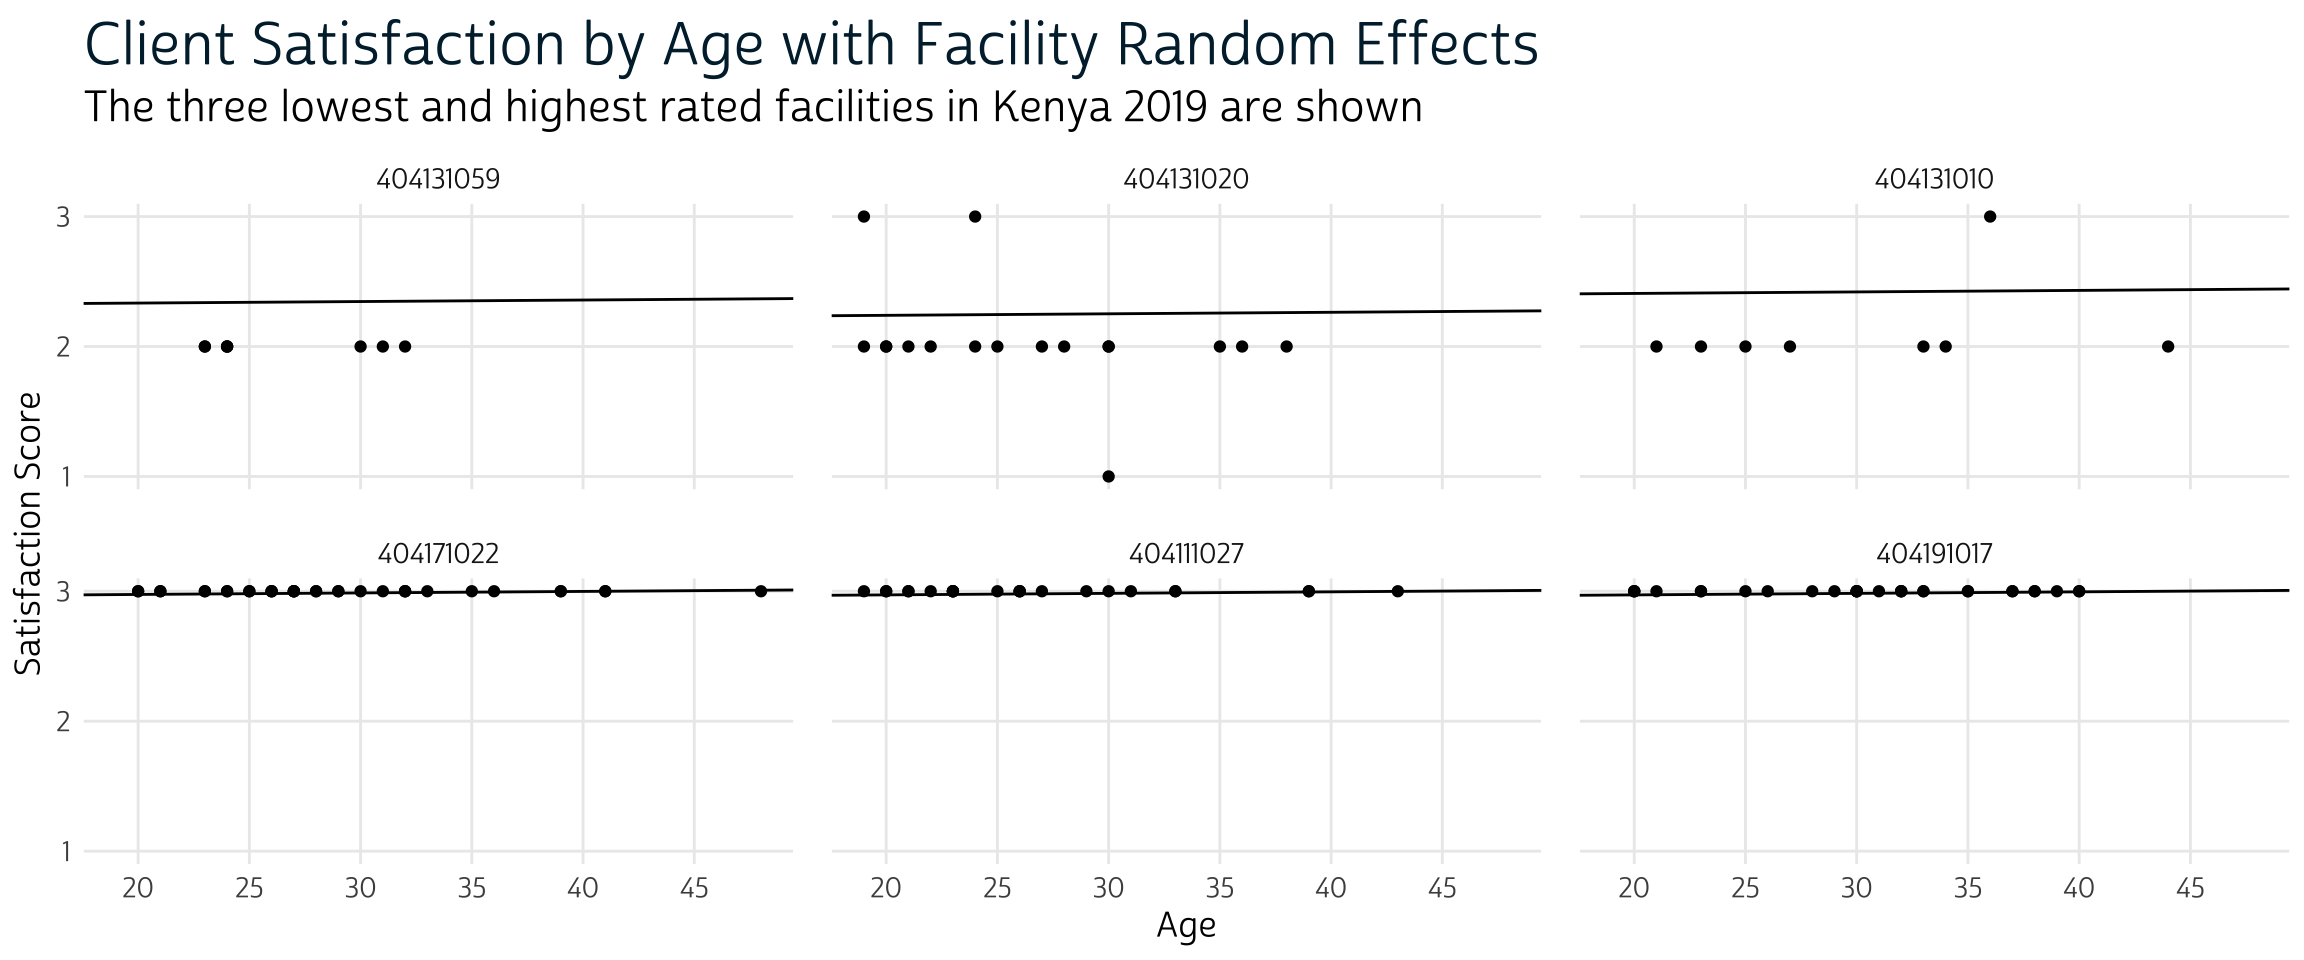
Modeling client satistifaction with both individual and facility characteristics
We use multilevel models to examine factors related to women's satisfaction with family planning care received from the service delivery facilities in Kenya.
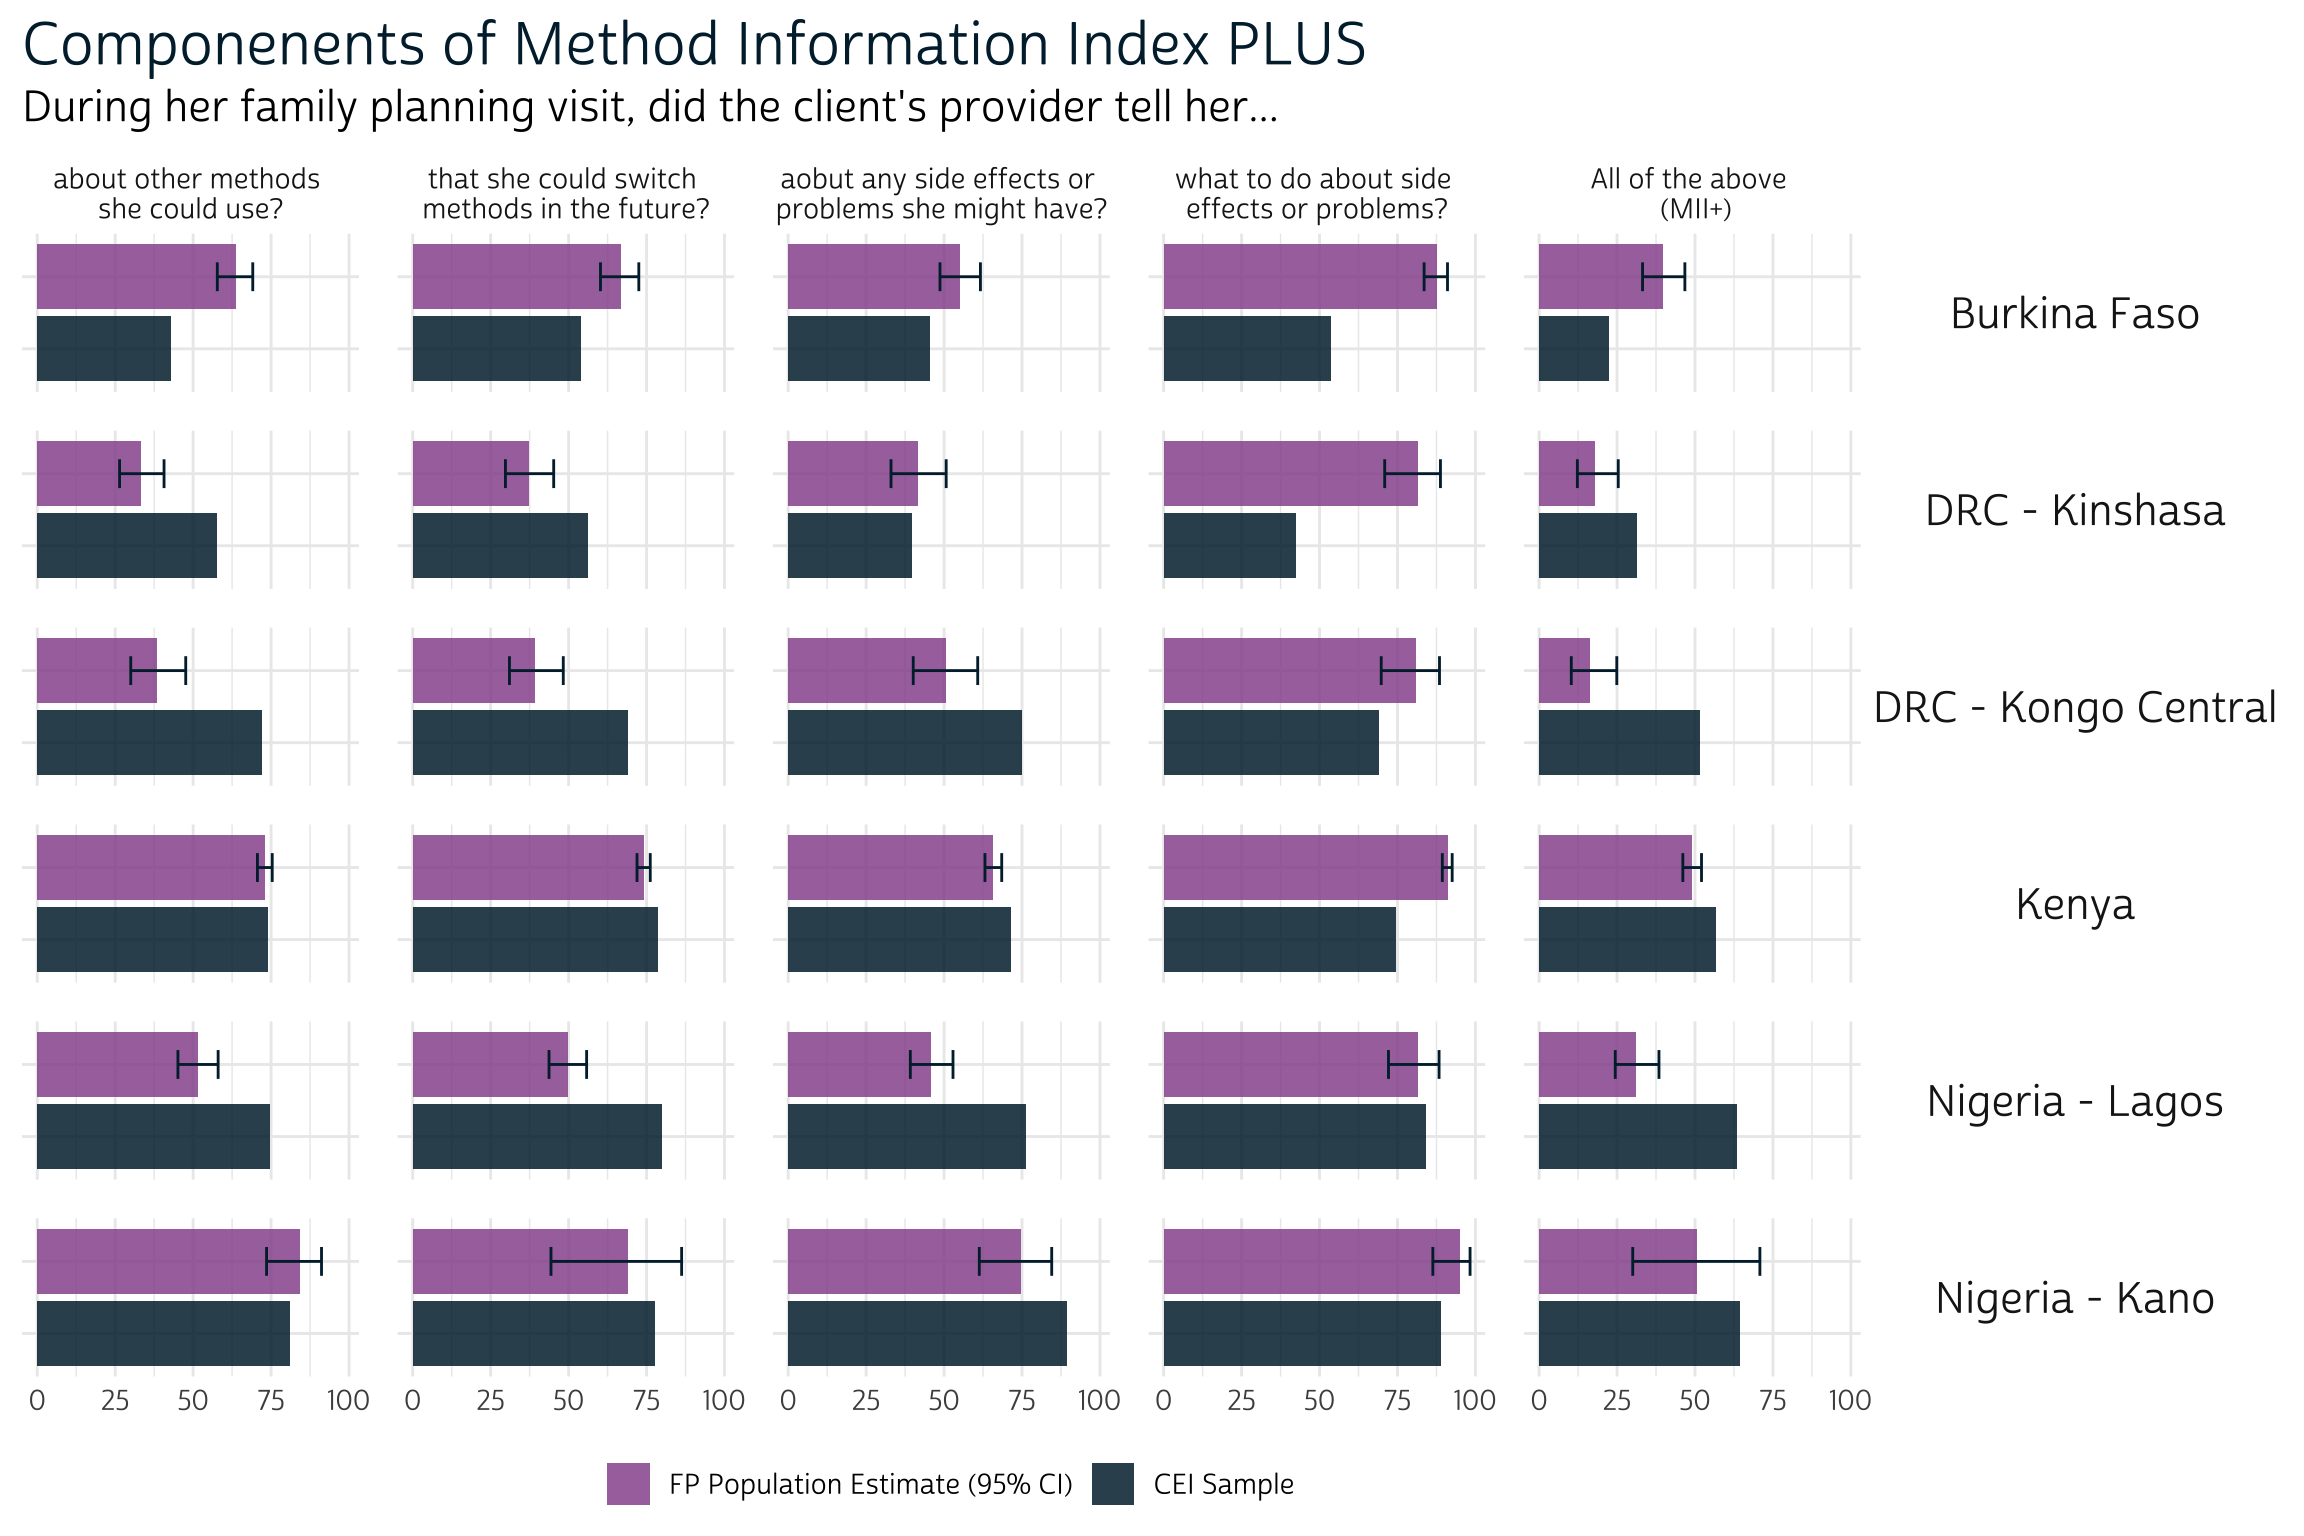
Comparing client experiences with family planning service providers
Service quality questions are included in both Client Exit Interview and Family Planning surveys from PMA. We show how to match similar questions across surveys and compare the results with faceted graphics.
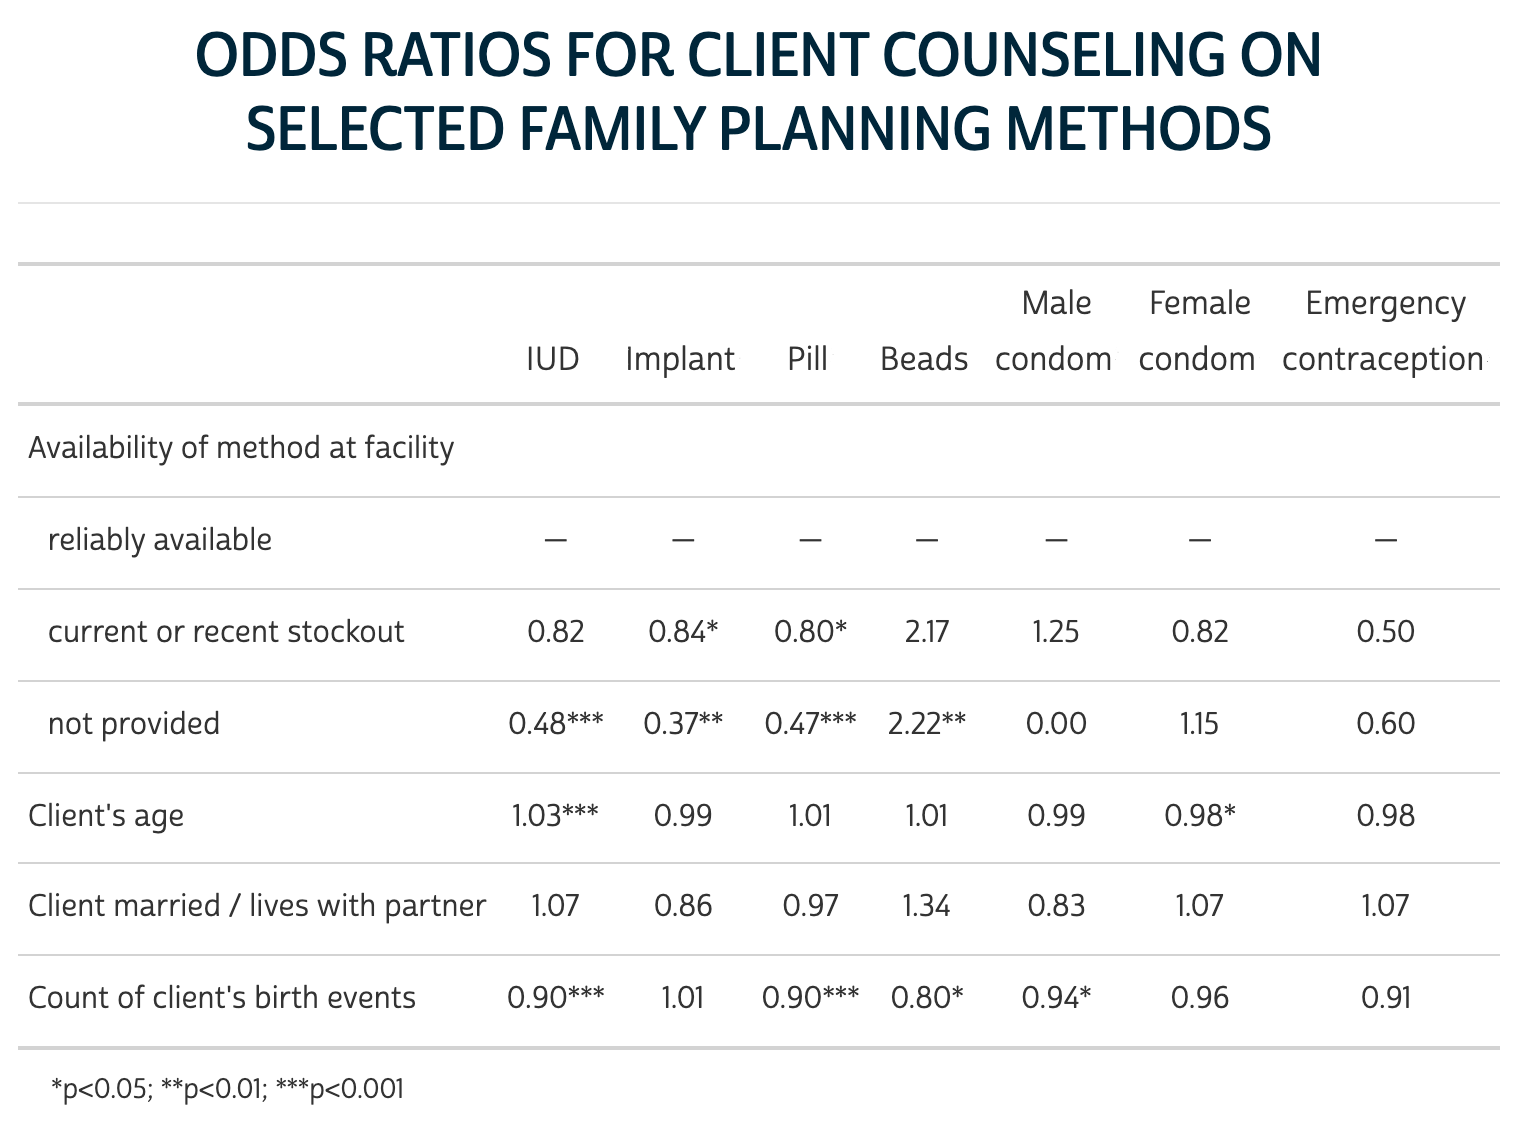
Building many similar models: easy variable substitution with 'pack' and 'across'
SDP surveys include data on the availability, cost, and demand for up to 13 family planning methods at each facility. Use one generic formula to explore independent models for client counseling on each method.
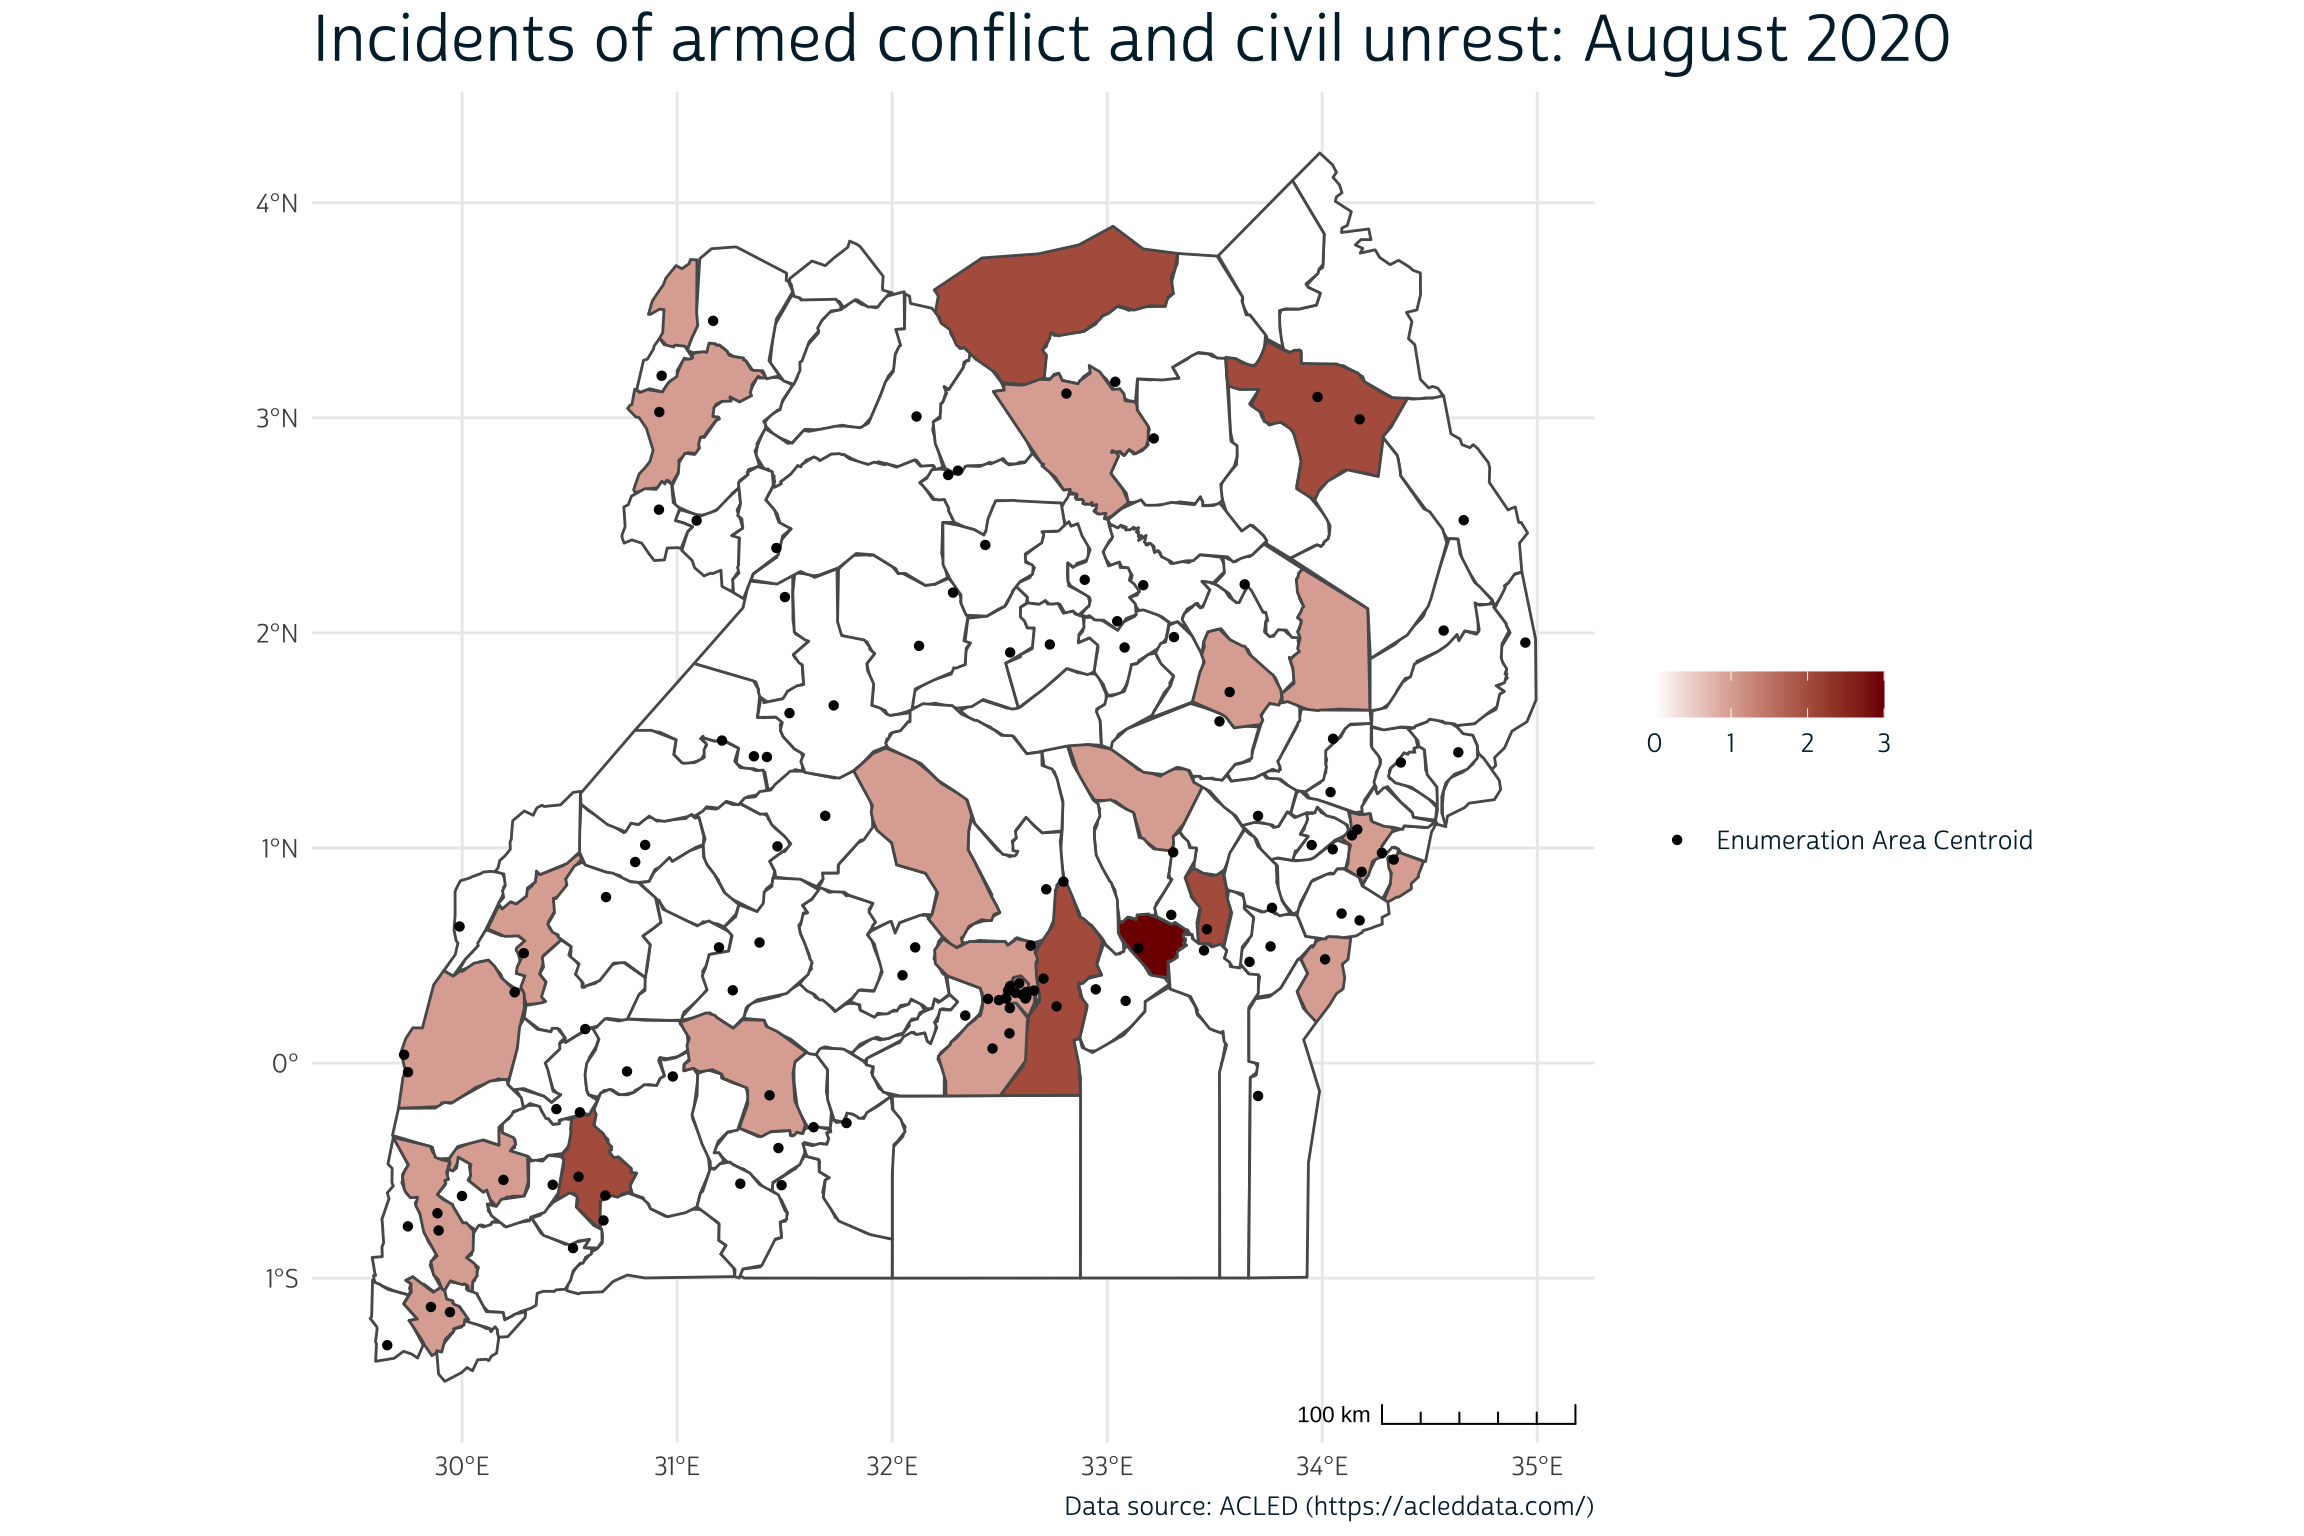
How to integrate ACLED conflict data with PMA Client Exit Interview data
Conflict data provides important context for access to family planning services.

Introducing Client Exit Interviews
Women receiving family planning services assess their care in a new data series from PMA.
2021 Blog Round-Up
Where to find example code for all of the key concepts we've covered so far.
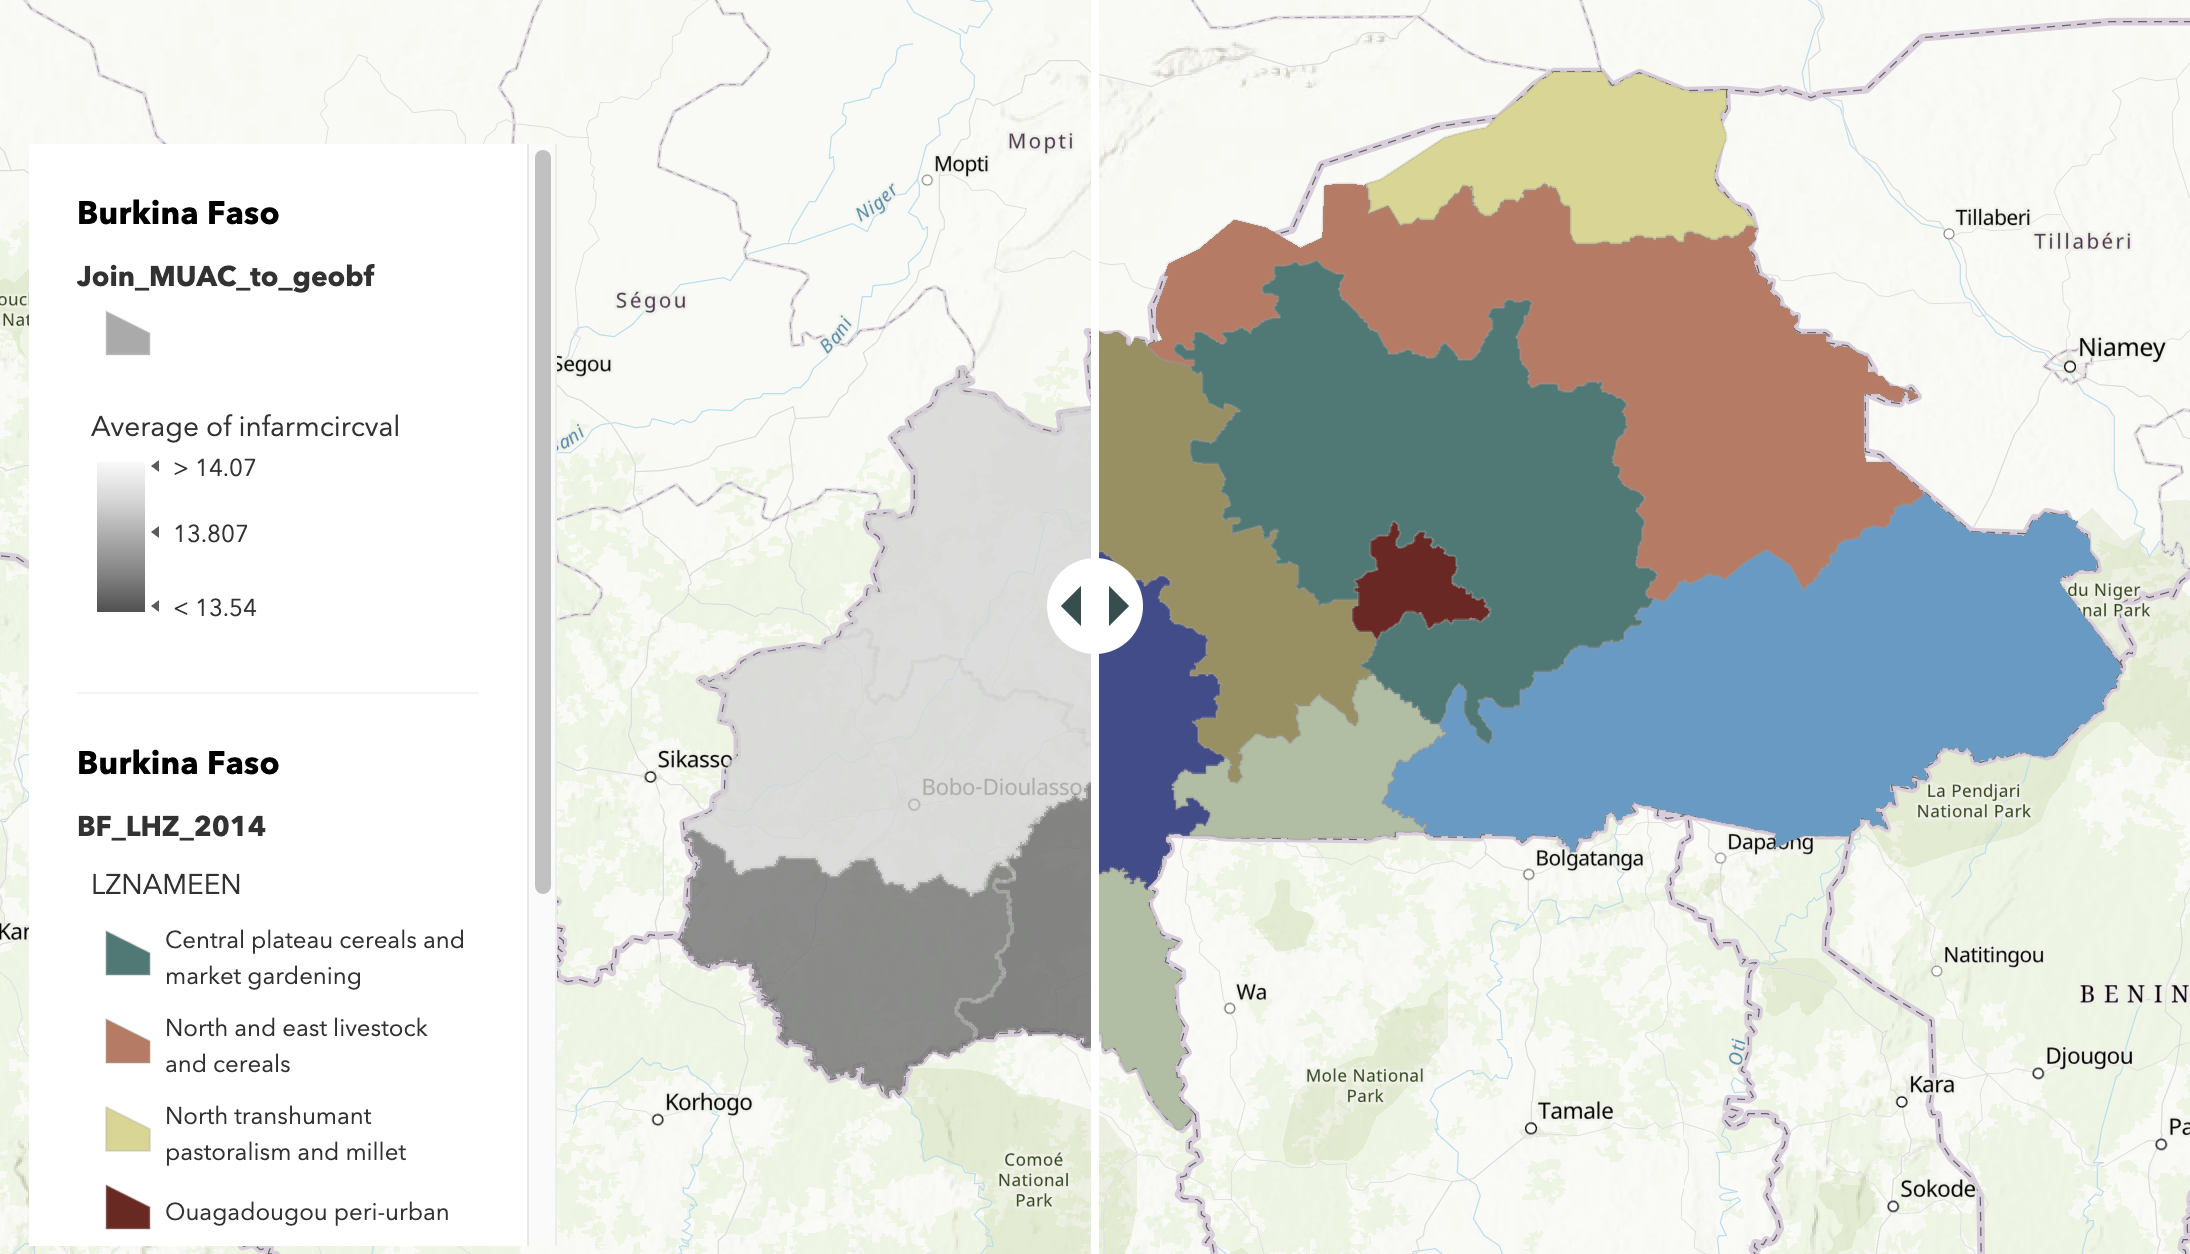
Measuring agricultural conditions and their relationship with infant nutrition in Burkina Faso
We've learned how to build key indicators with spatially referenced nutrition data from PMA. Now let's see how researchers have used them.
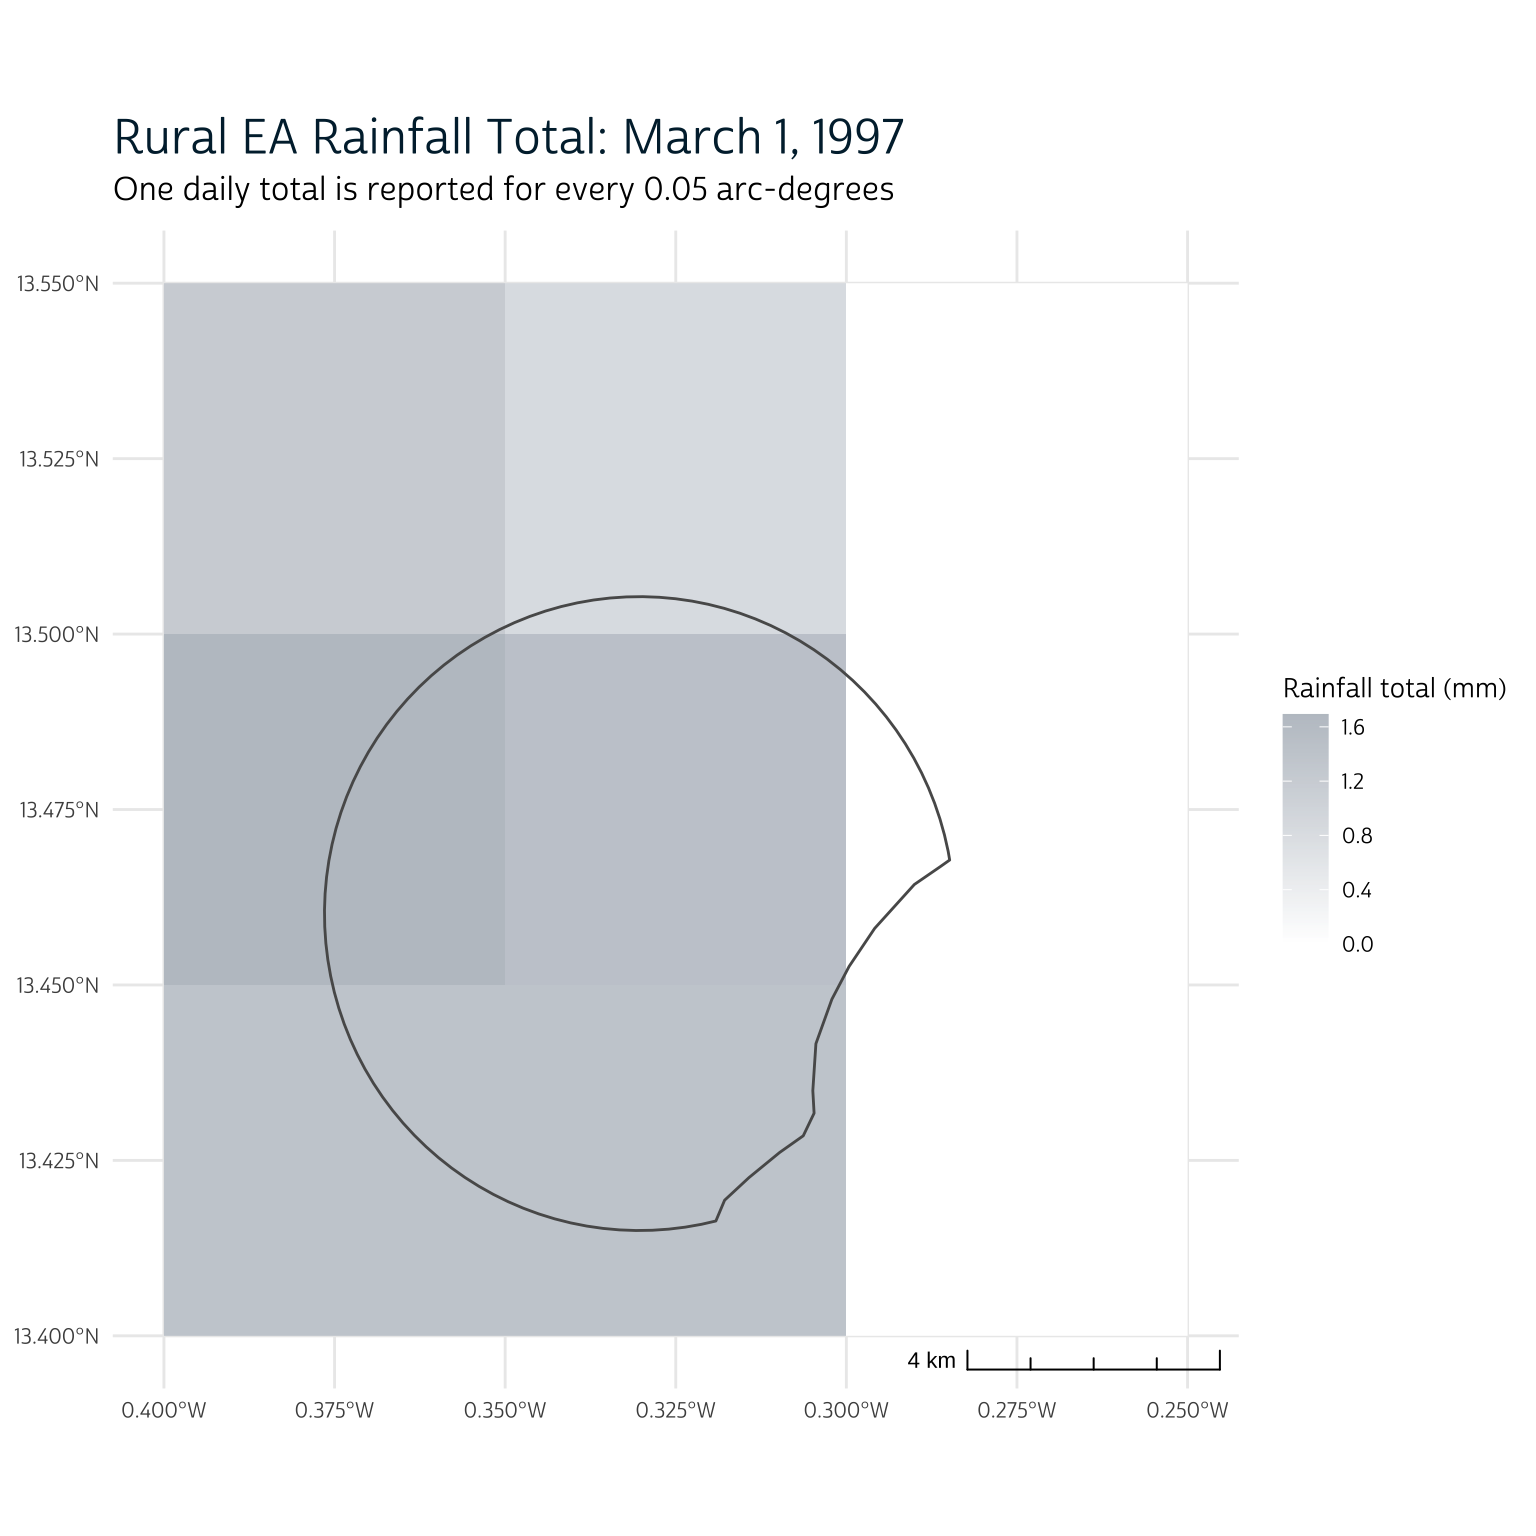
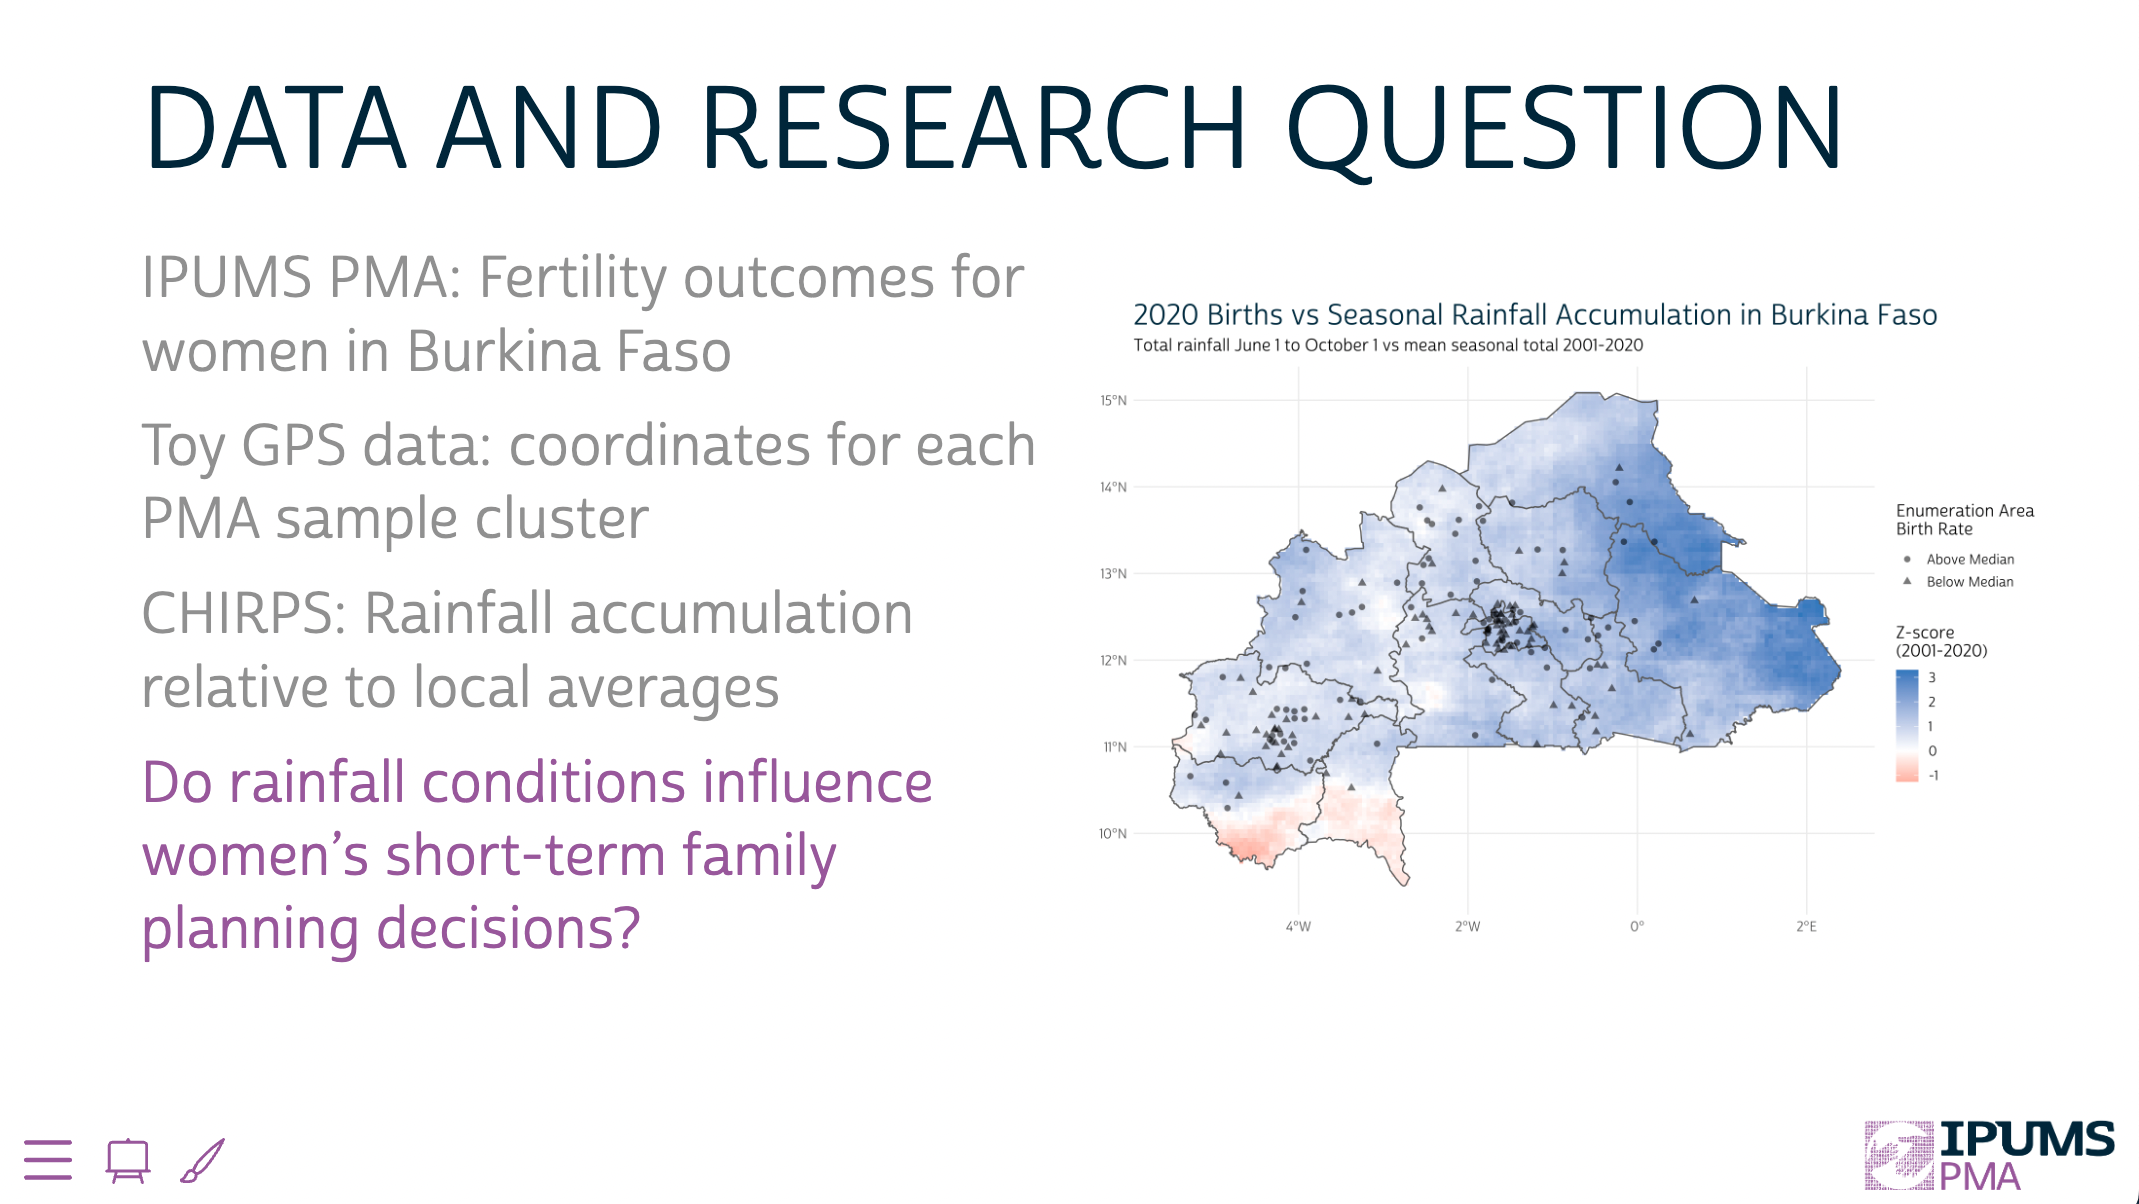
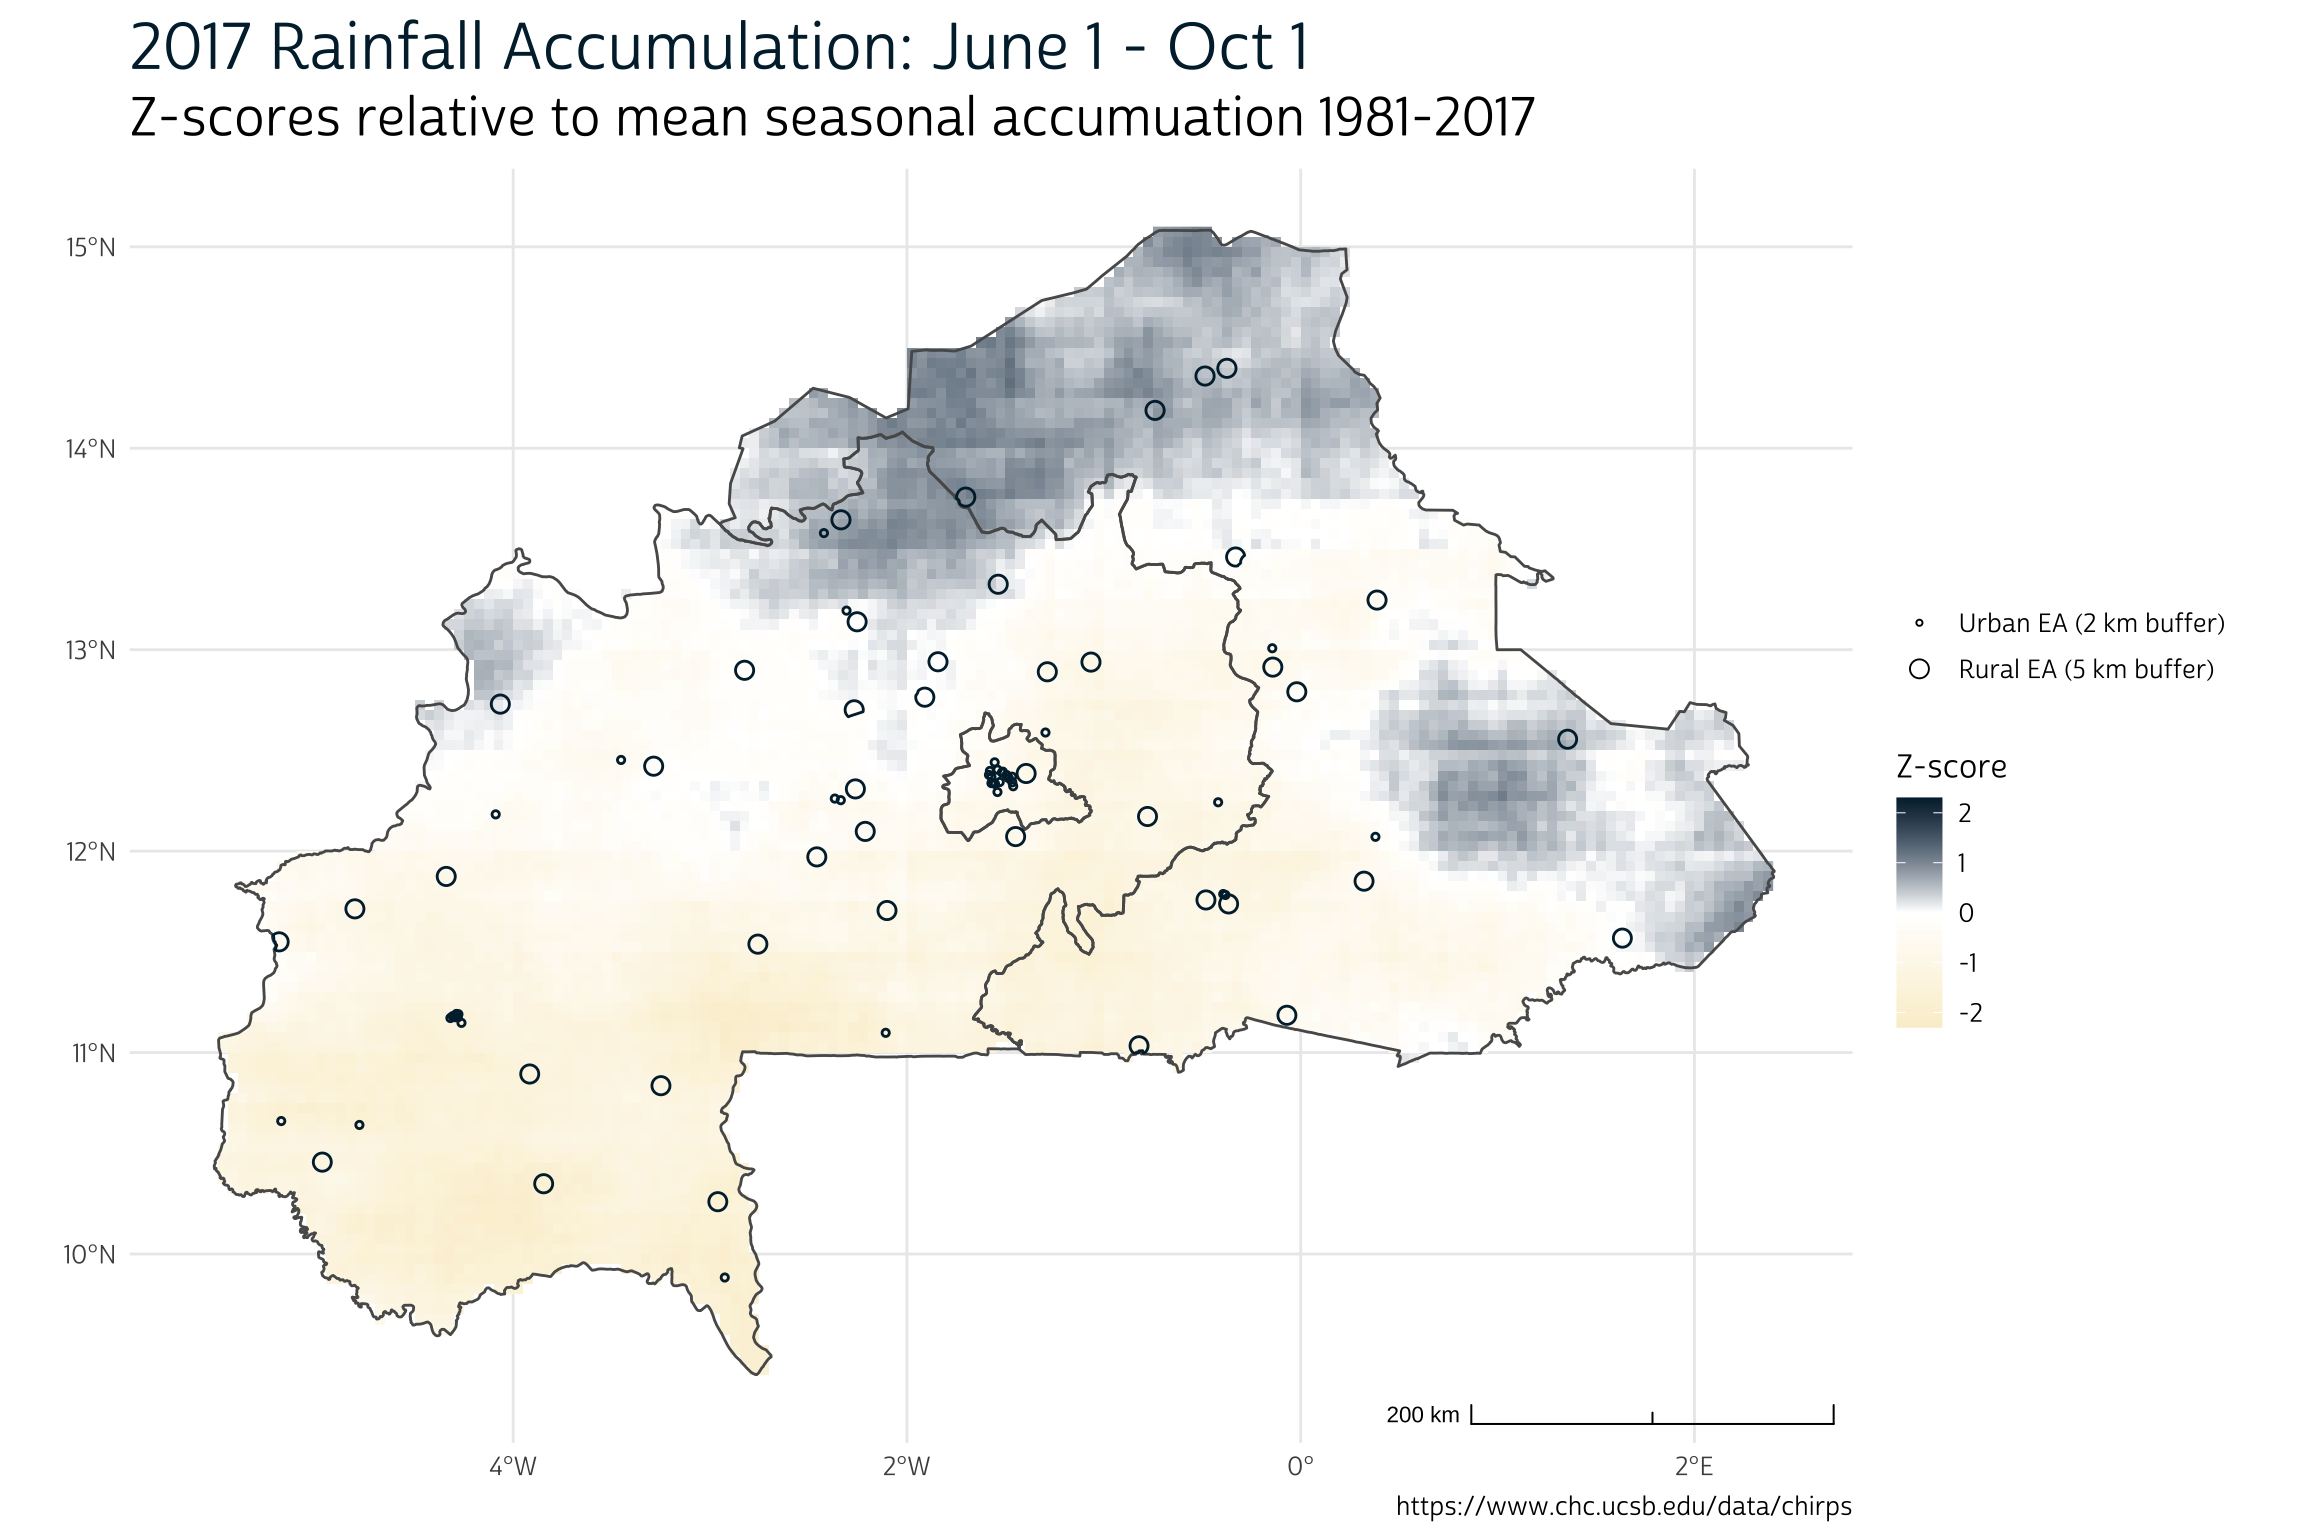
How to use CHIRPS Climate Data with PMA Nutrition Surveys
Remotely sensed daily precipitation data is an incredible resource for understanding rainfed food systems.
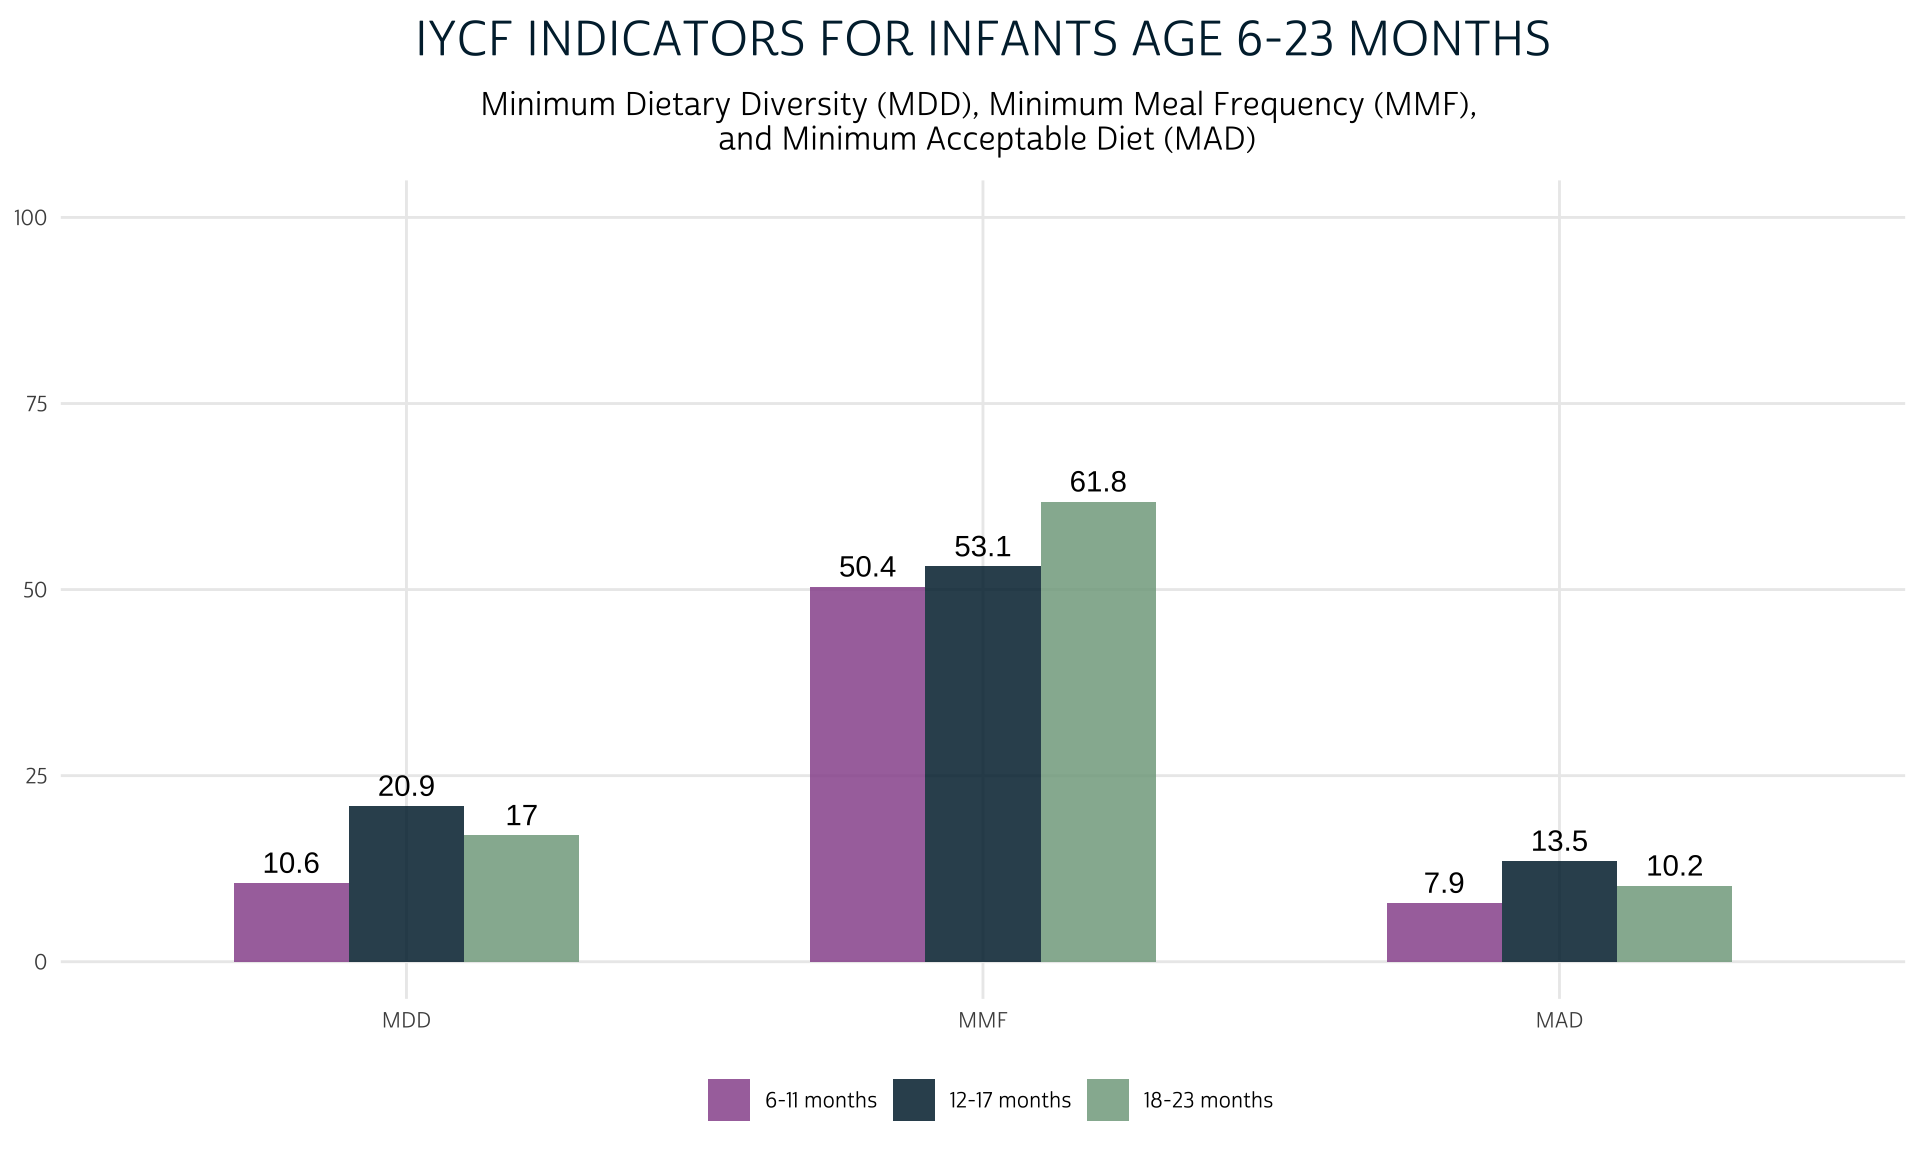
Infant and Young Child Feeding (IYCF) Indicators for PMA Nutrition Data
Use WHO guidelines to calculate Minimum Dietary Diversity (MDD), Minimum Meal Frequency (MMF), and Minimum Acceptable Diet (MAD).

Update: Matching Records in 2018 Nutrition Surveys
It's now much easier to perform row-wise operations with pre-grouped data!
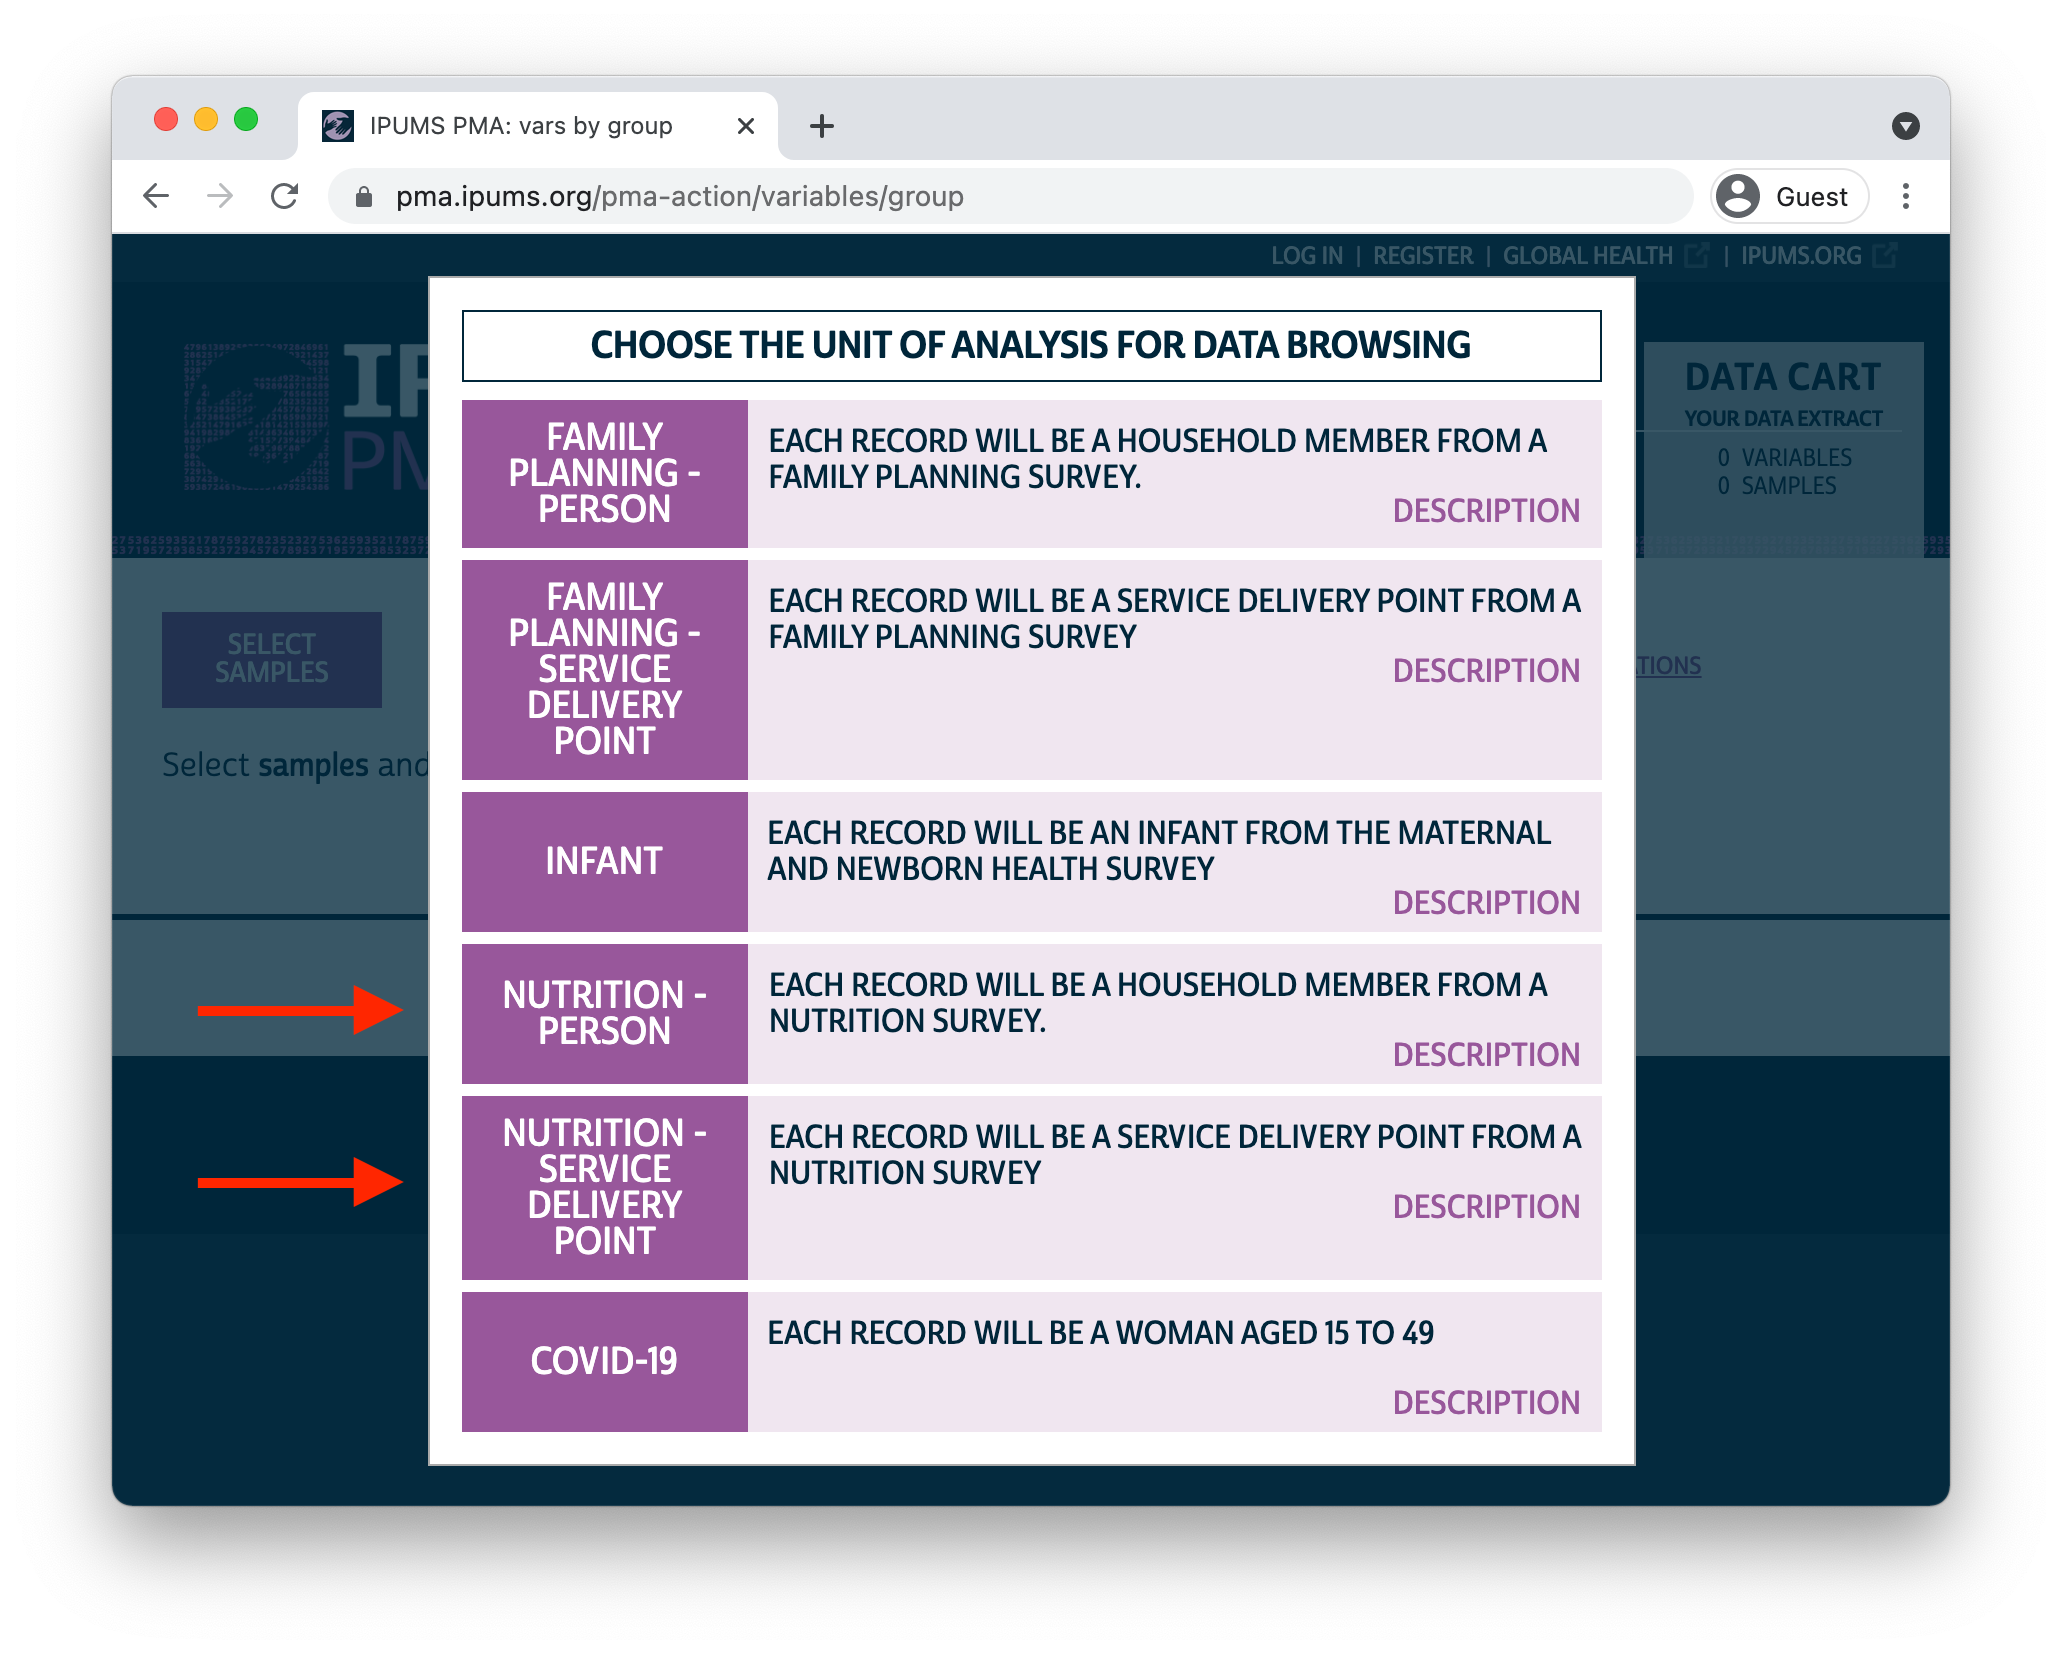
Introducing PMA Nutrition Data
Nutrition surveys are available for women, young children, and health service providers in their area.
Multinomial Regression with Complex Survey Design
The PMA COVID-19 survey is part of a broader panel study. We discuss how to merge it with the baseline survey, and how to specify sample weights and cluster information with the new svyVGAM package.

New Online Course: Introduction to IPUMS PMA Data Analysis
Explore IPUMS PMA data with R right in your browser, or download Stata code for offline practice
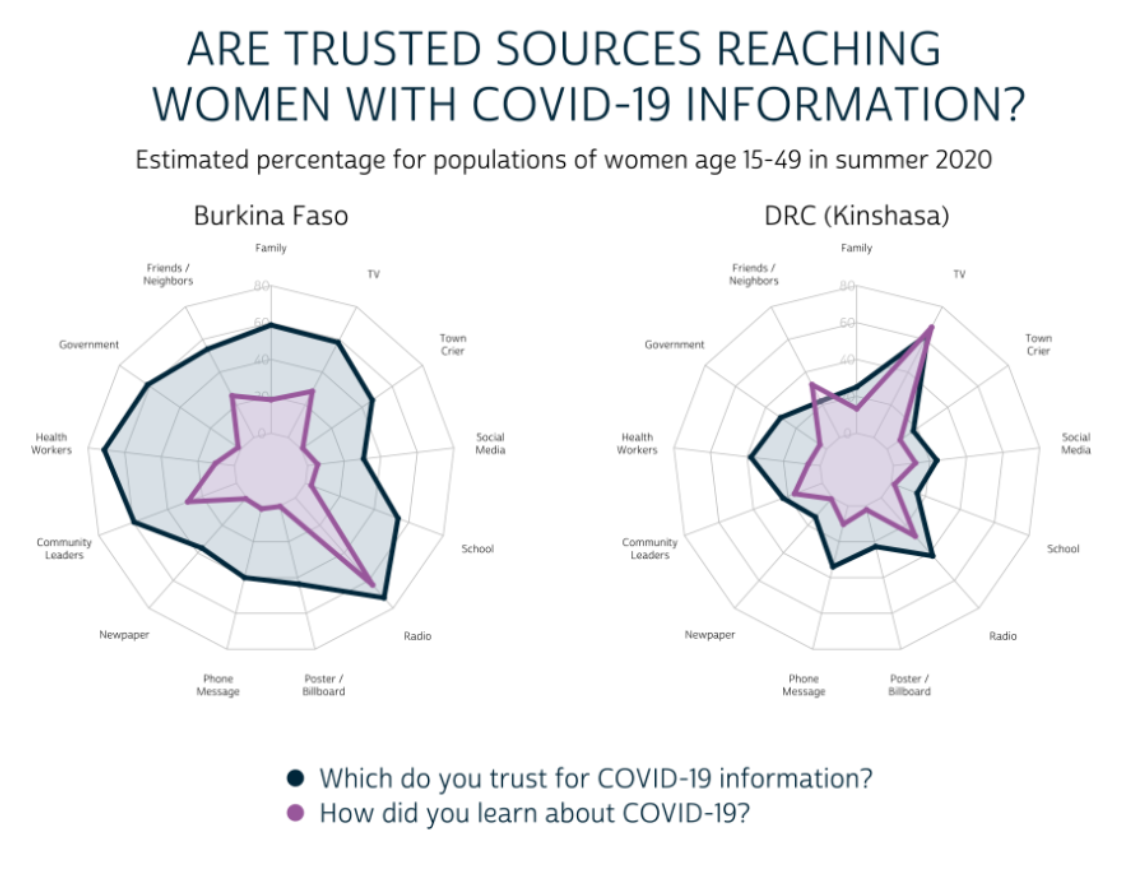
Three ways to visualize binary survey data
You can compare levels of trust and efficacy for 13 information sources in 4 countries with data from the new PMA COVID-19 survey. Let's talk data visualization options.
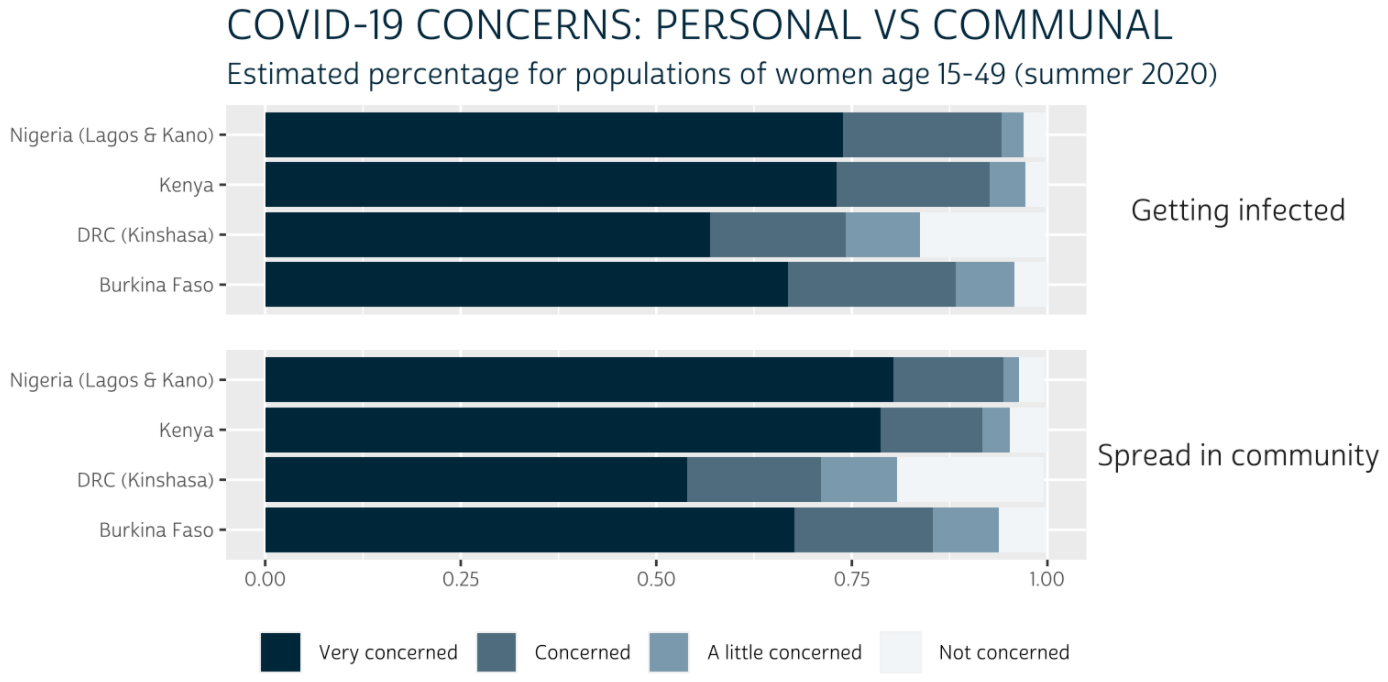
Visualizing perceptions of risk from COVID-19
A guide to bar charts for Likert-type psychometric scales built with ggplot2.

Making Tables with PMA COVID-19 Data
Showcasing the gtsummary package for sample descriptive statistics, weighted population estimates, and model summary output.

New PMA COVID-19 Survey Data
A new panel study promises insights into the impact of COVID-19 on family planning and reproductive health.
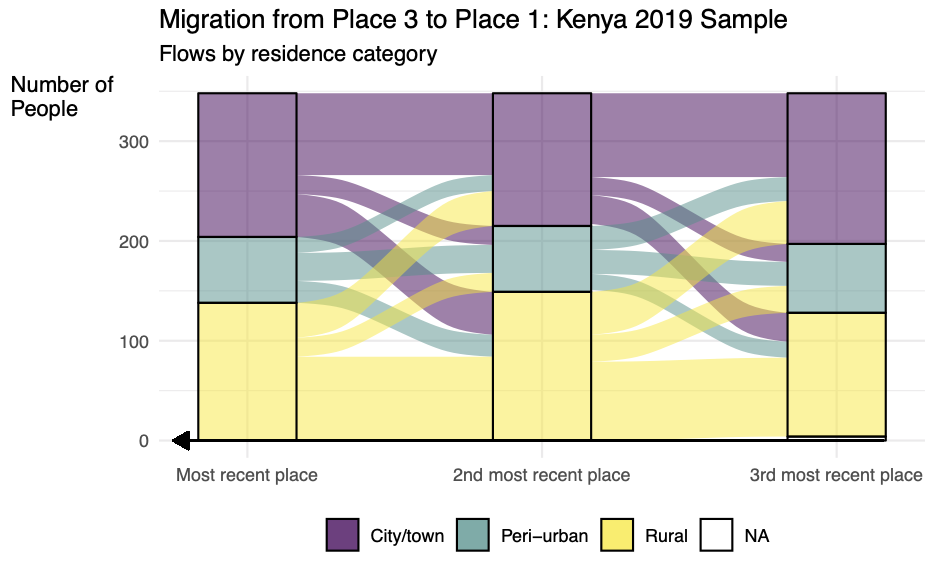
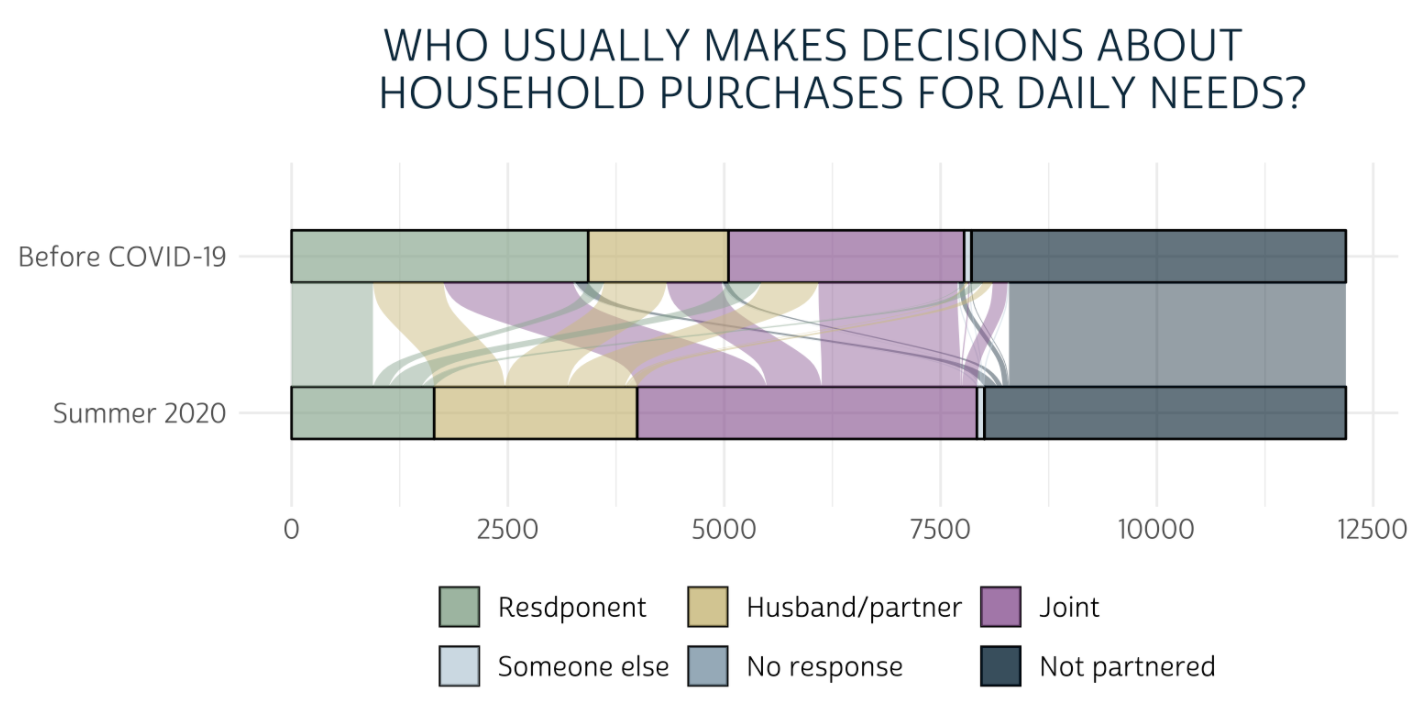
Visualizing migration patterns over time
How to visualize patterns in migration data using alluvial plots, line plots, and density plots.
Making the Contraceptive Calendar Data Work For You
R and Stata code with video from an event held at the Population Association of America 2021 Annual Meeting.
Visualizing PMA Data with StoryMaps
Five outstanding undergraduate research projects integrate dynamic data visualization with spatial analysis and narrative.

Formatting Migration Recall Data for Longitudinal Analysis
Use tidyr::pivot_longer to reshape wide data into a long format.
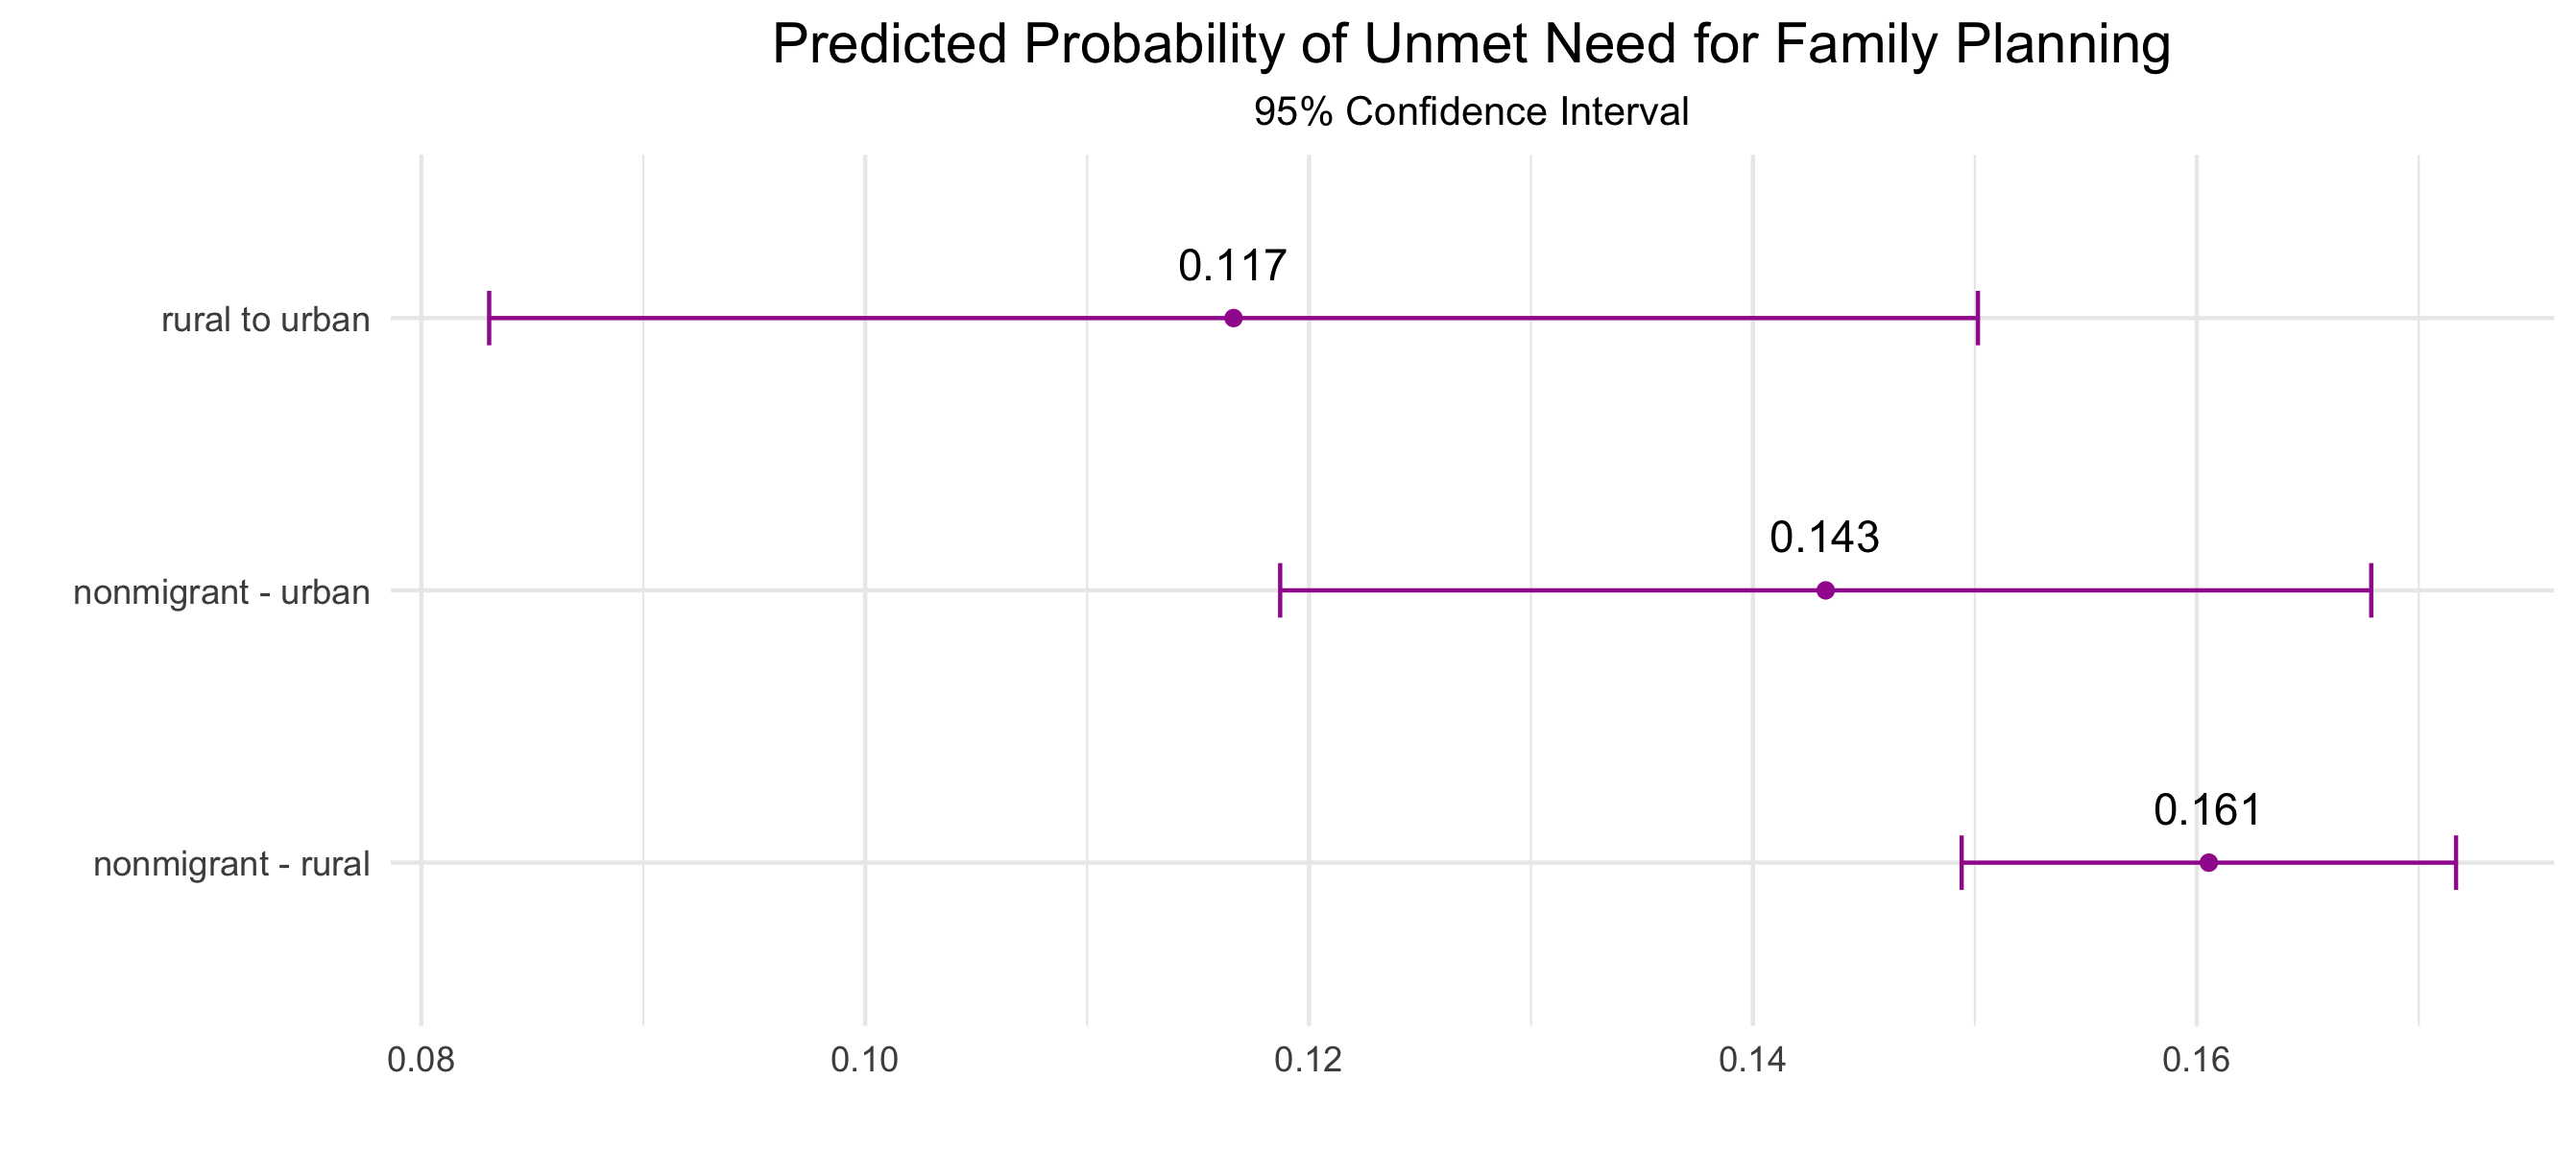
Unmet need for family planning after internal migration
Summary and source code from a recent article using data from Ethiopia.

New SDP Data Available Spring 2021
Get details on new variables related to labor & delivery services, antenatal care, vaccinations, facility shipment schedules, and more!
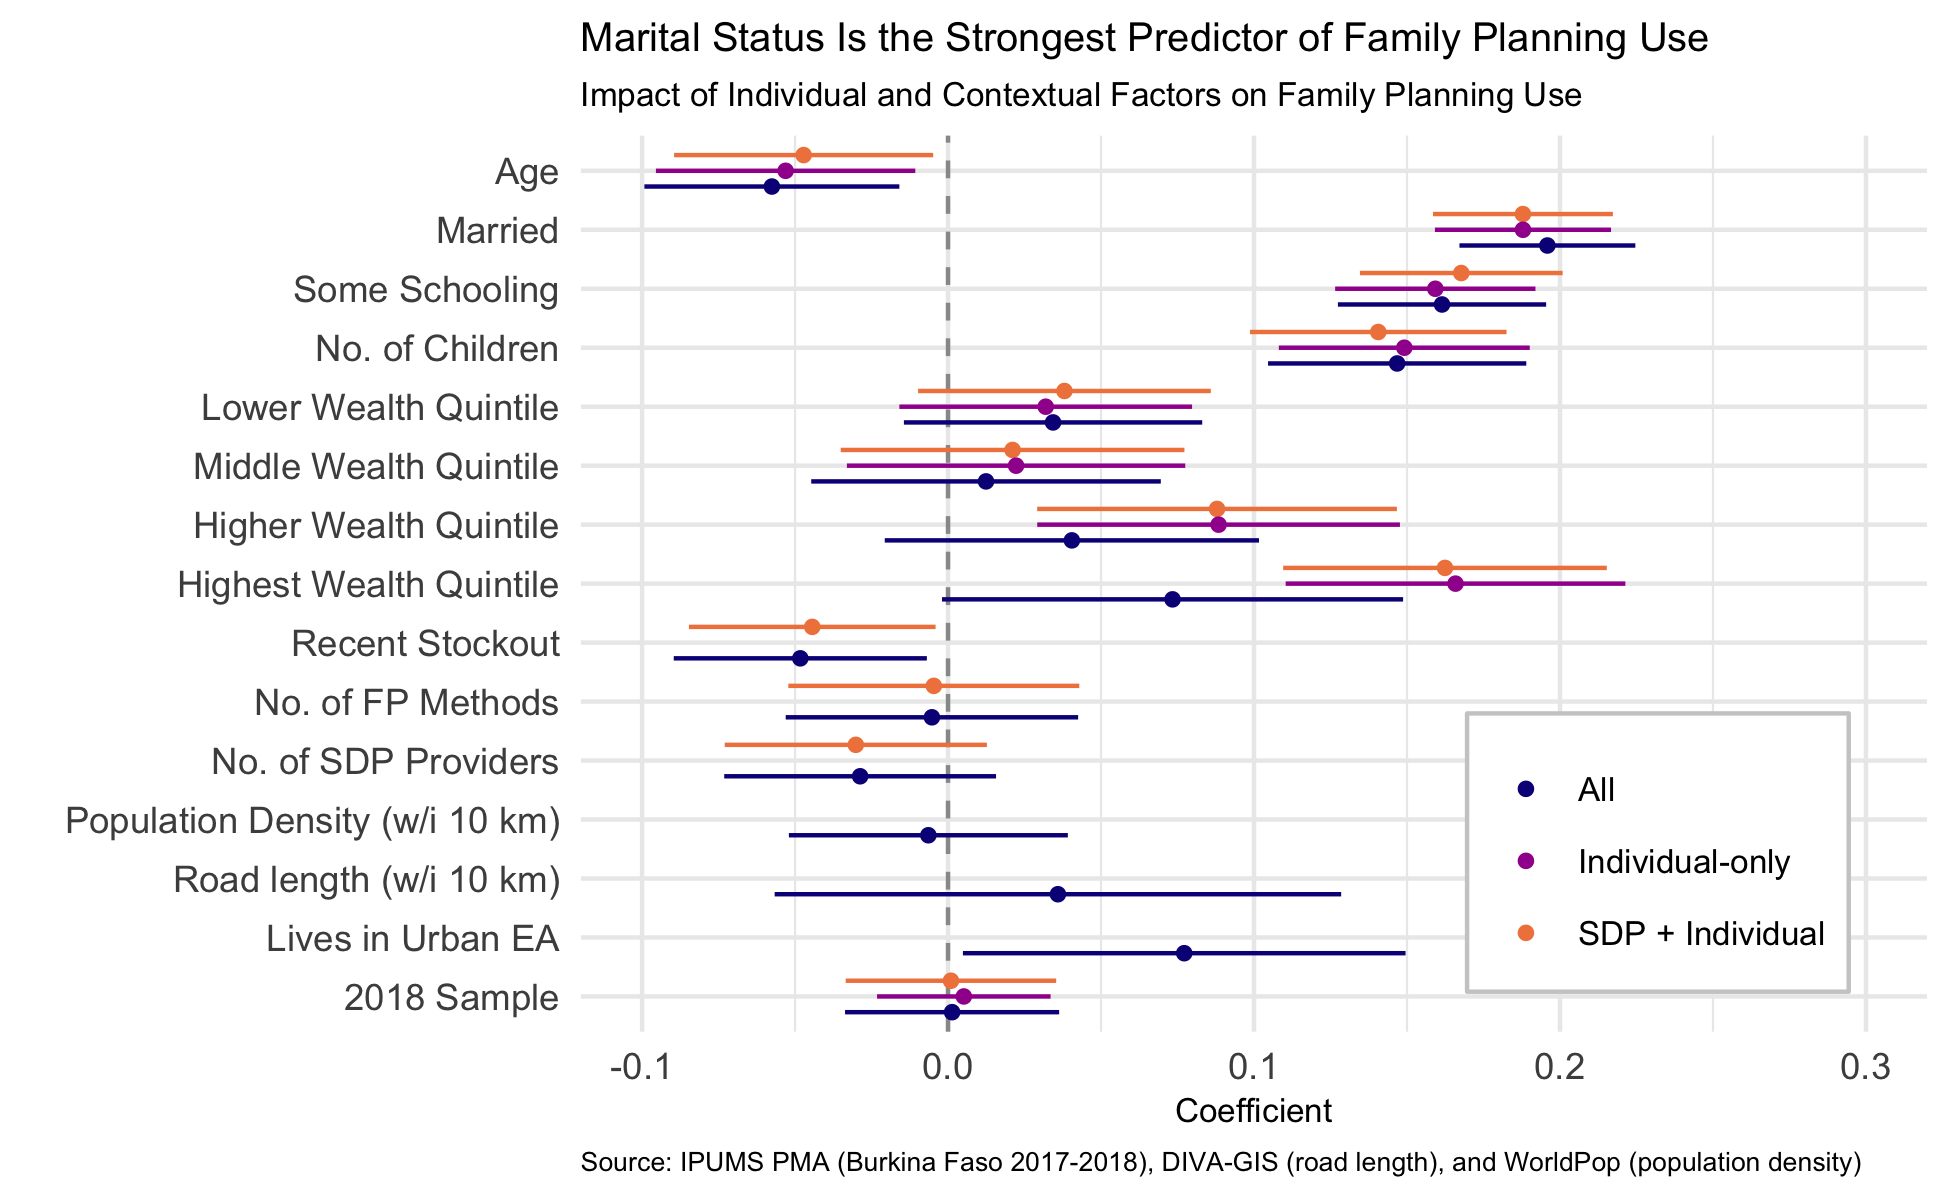
Putting It All Together: Analyzing the Individual in Context
Analyzing women's contraceptive use while considering service delivery point and spatial contextual factors.
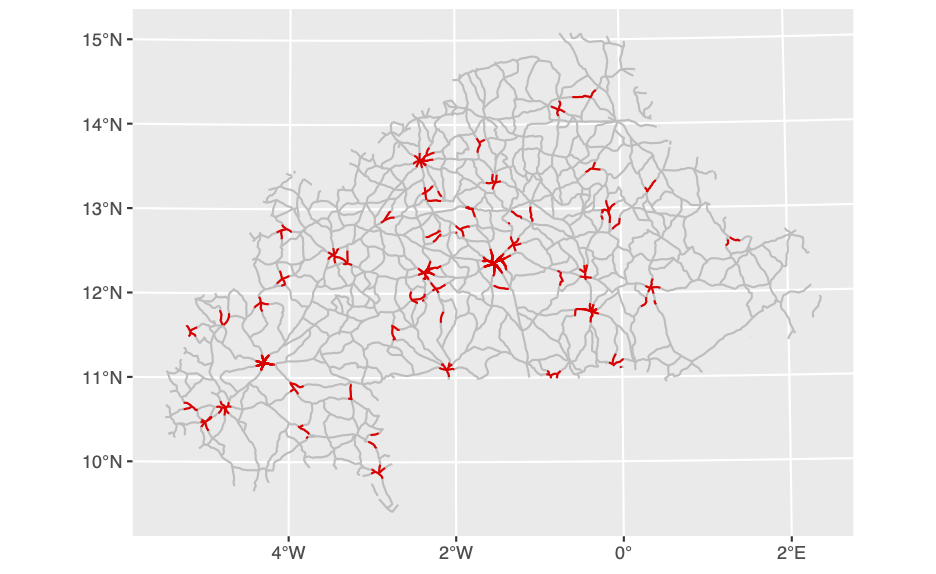
Merging external spatial data
How to integrate external spatial data with PMA data.
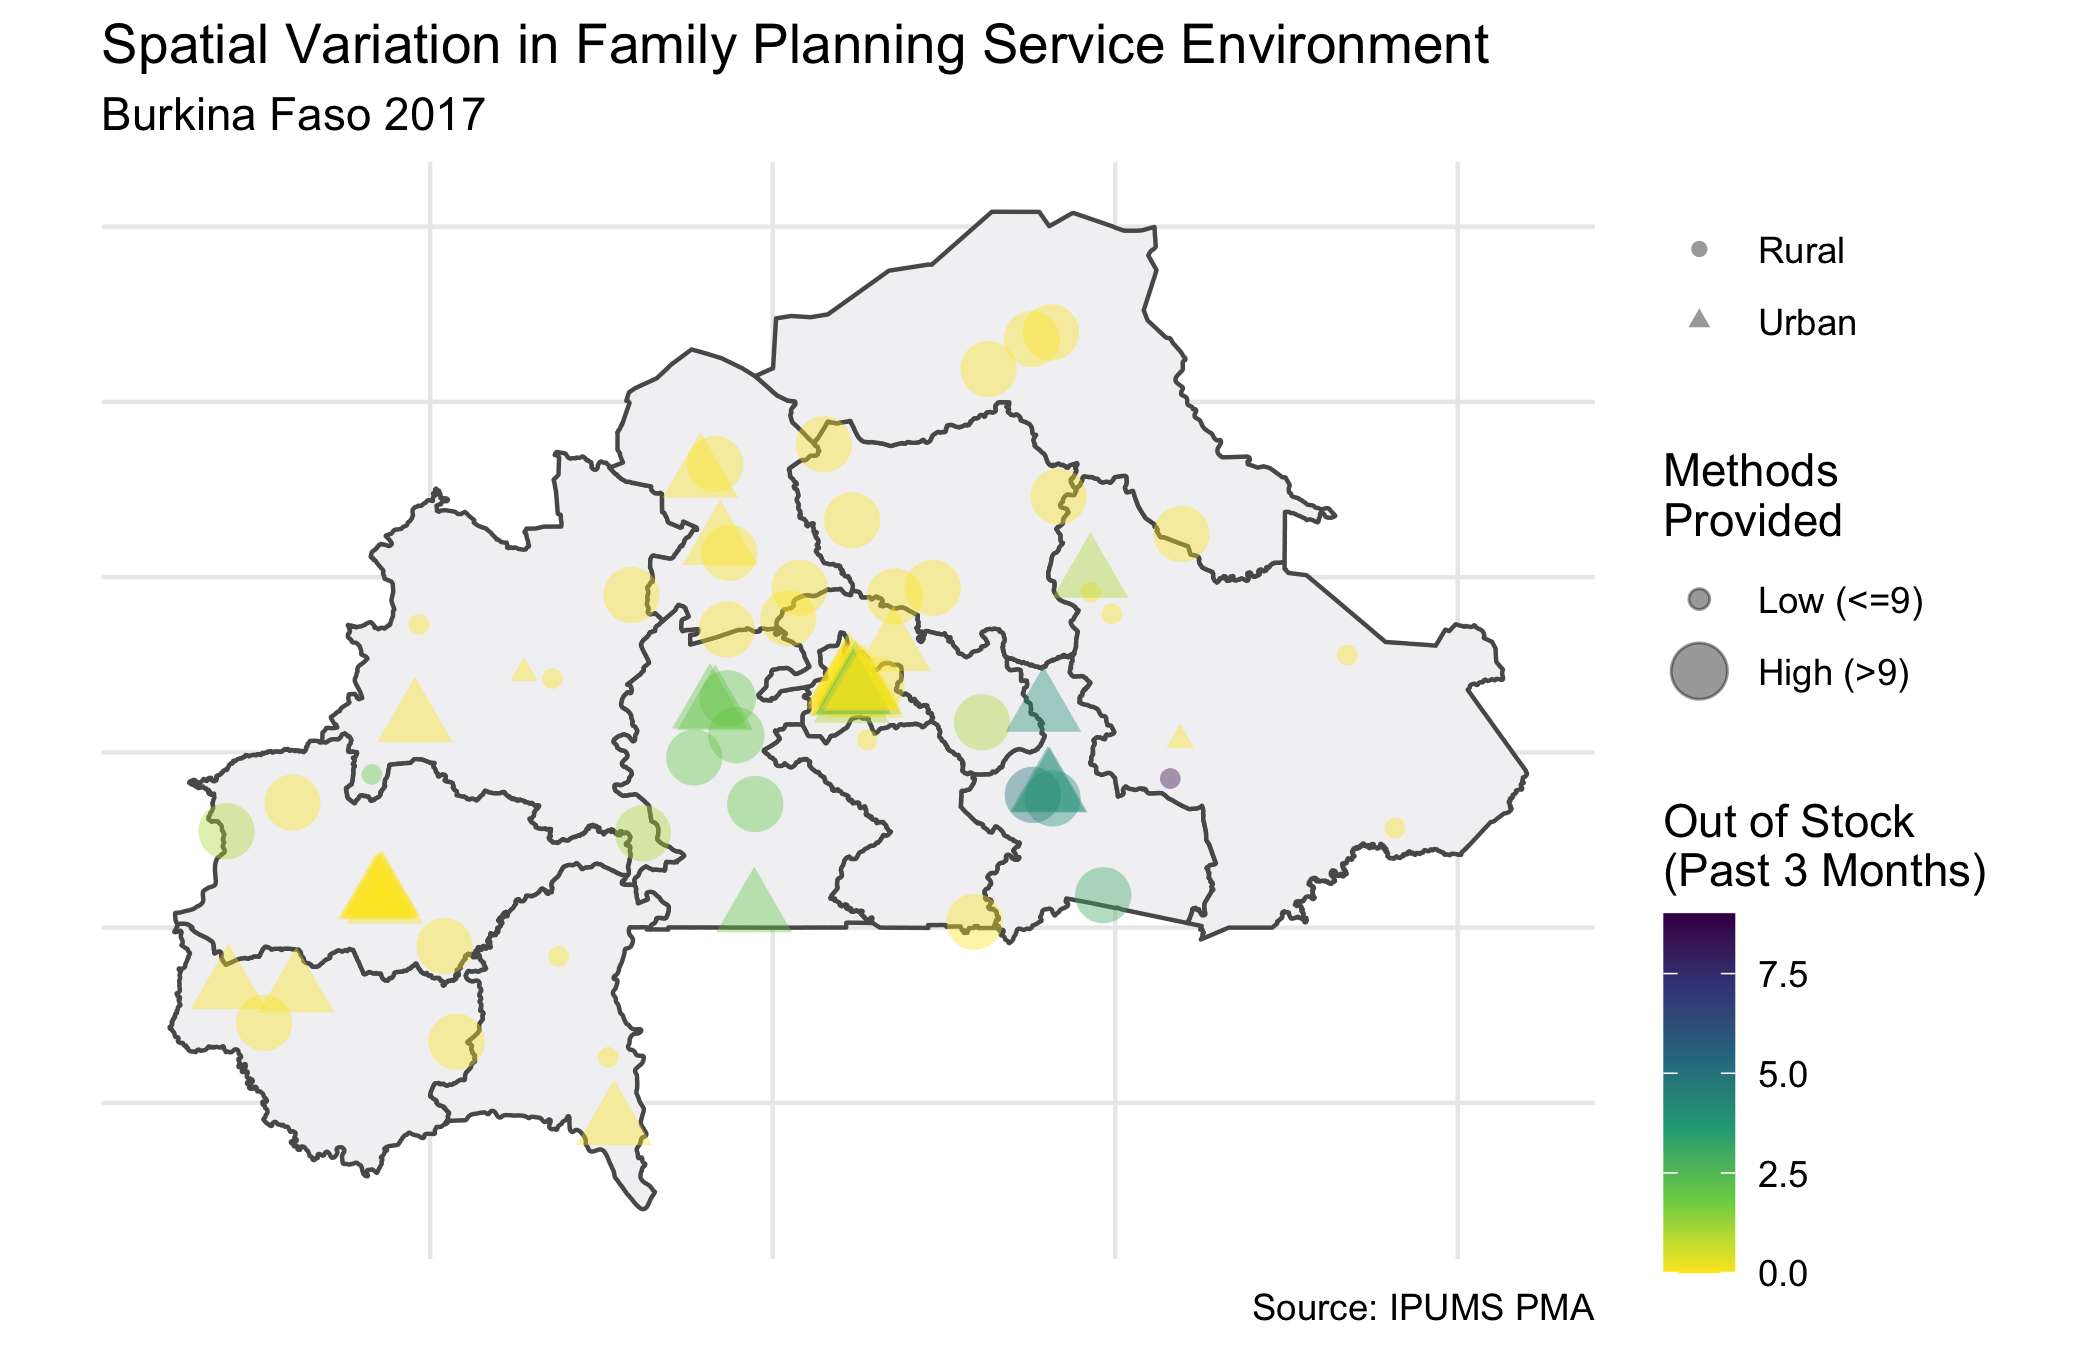
Mapping Service Delivery Point Data
Map spatial variation in the service delivery environment across enumeration areas.
Merging Service Delivery Point Data to Household & Female Records
Create aggregate measures for women living the areas served by SDPs

Recode and Summarize Variables from Multiple Response Questions
Use dplyr::across to summarize variables with a similar naming pattern.
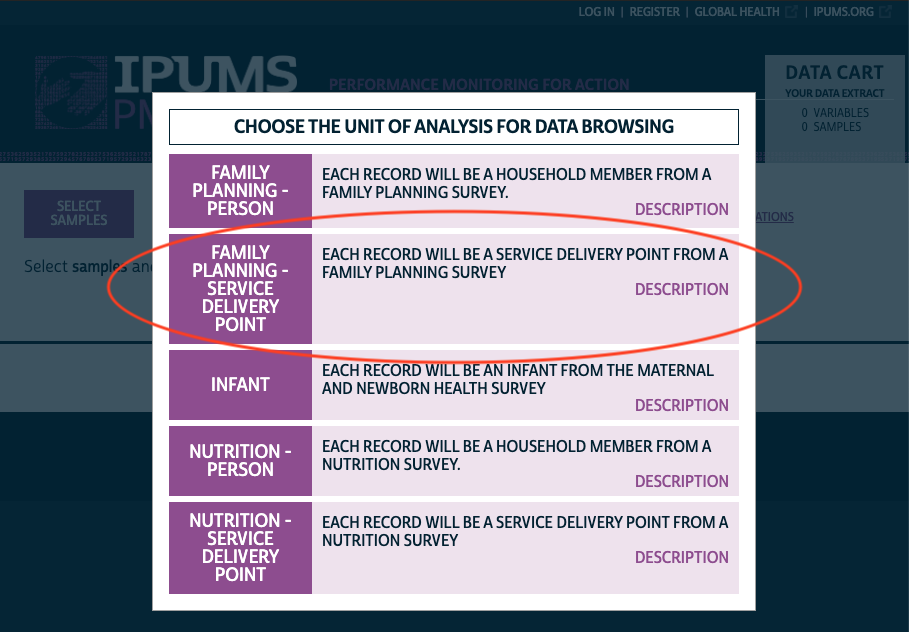
Service Delivery Point Data Explained
SDP samples are not nationally representative. Learn how to use them to describe the health service environment experienced by individuals.
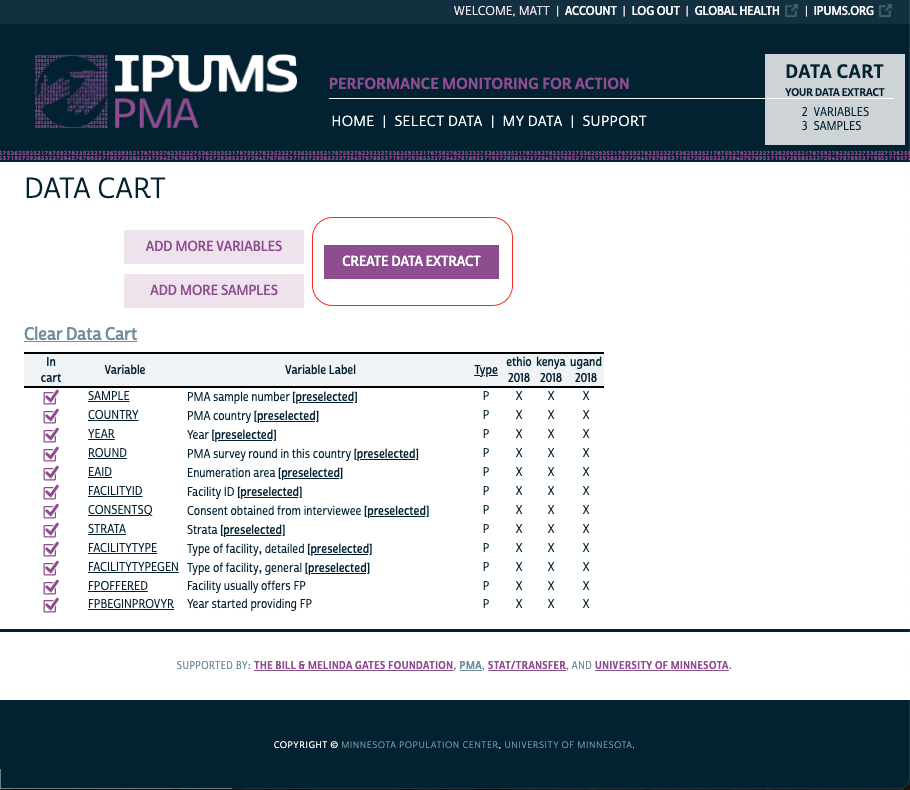
Import IPUMS PMA Data into R
How to download an IPUMS PMA data extract and start using it in R
Getting Started with R
How to download R for free and install some of the R packages used on this blog