We launched the IPUMS PMA Data Analysis Hub one year ago this week, and we’ve covered a lot since then! As we’re gearing up for new series exploring Client Exit Interviews and longitudinal analysis with Round 2 Panel Data in the coming months, we thought it might be a nice time to pause and take inventory of the important concepts we’ve covered in our first year.
Introduction Course
Looking for a place to start learning about IPUMS PMA data with coding examples in your preferred programming language? Check out our new online introduction course! This course is free and open to all registered IPUMS PMA data users. You’ll learn all about PMA surveys, the IPUMS data extract system, and basic analysis tools for R or Stata.
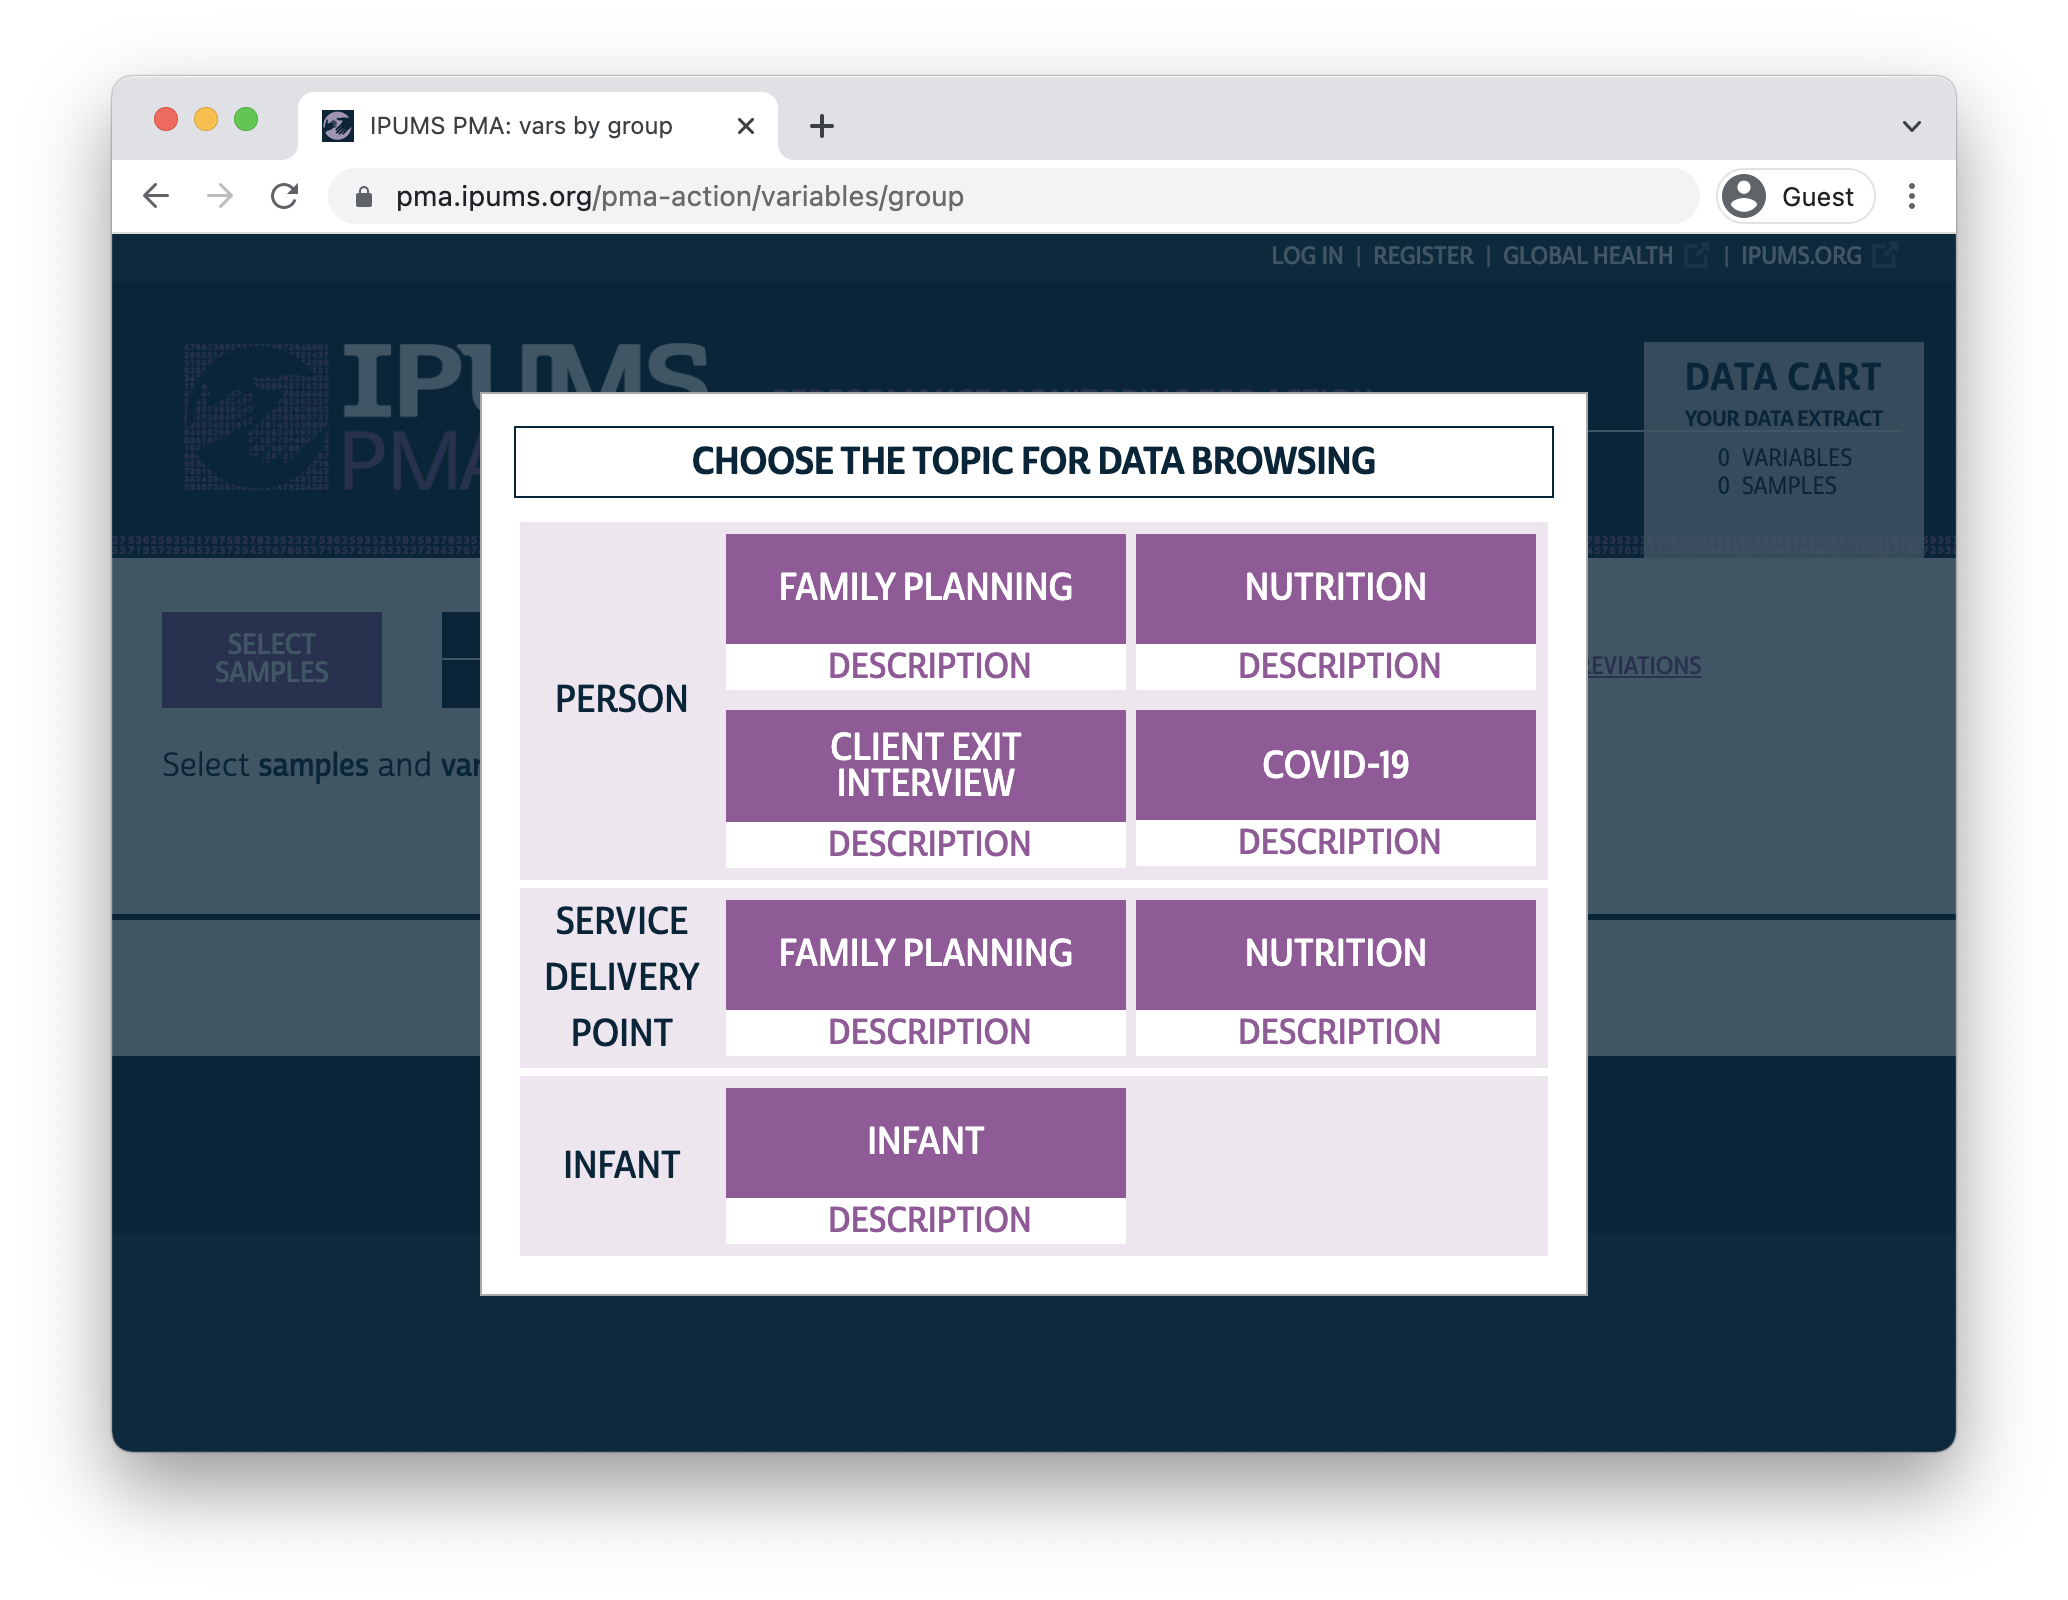
Data Discovery
Our Data Discovery posts are where you’ll find announcements about new data releases and deep-dives into available data for a featured topic. So far, we’ve explored:
- Service Delivery Point (SDP) surveys
- COVID-19 surveys
- Nutrition surveys for women and young children
- Migration history data
- External sources for climate, population density, and infrastructure data that complement PMA surveys
Data Manipulation
A Data Manipulation post typically showcases tips for recoding, reshaping, describing, or visualizing variables included in an IPUMS PMA data extract. Often, we’ll feature tools from one or two of our favorite R packages; while we always recommend visiting package documentation websites, our goal here is to show why these tools are important specifically for working with data from IPUMS PMA.
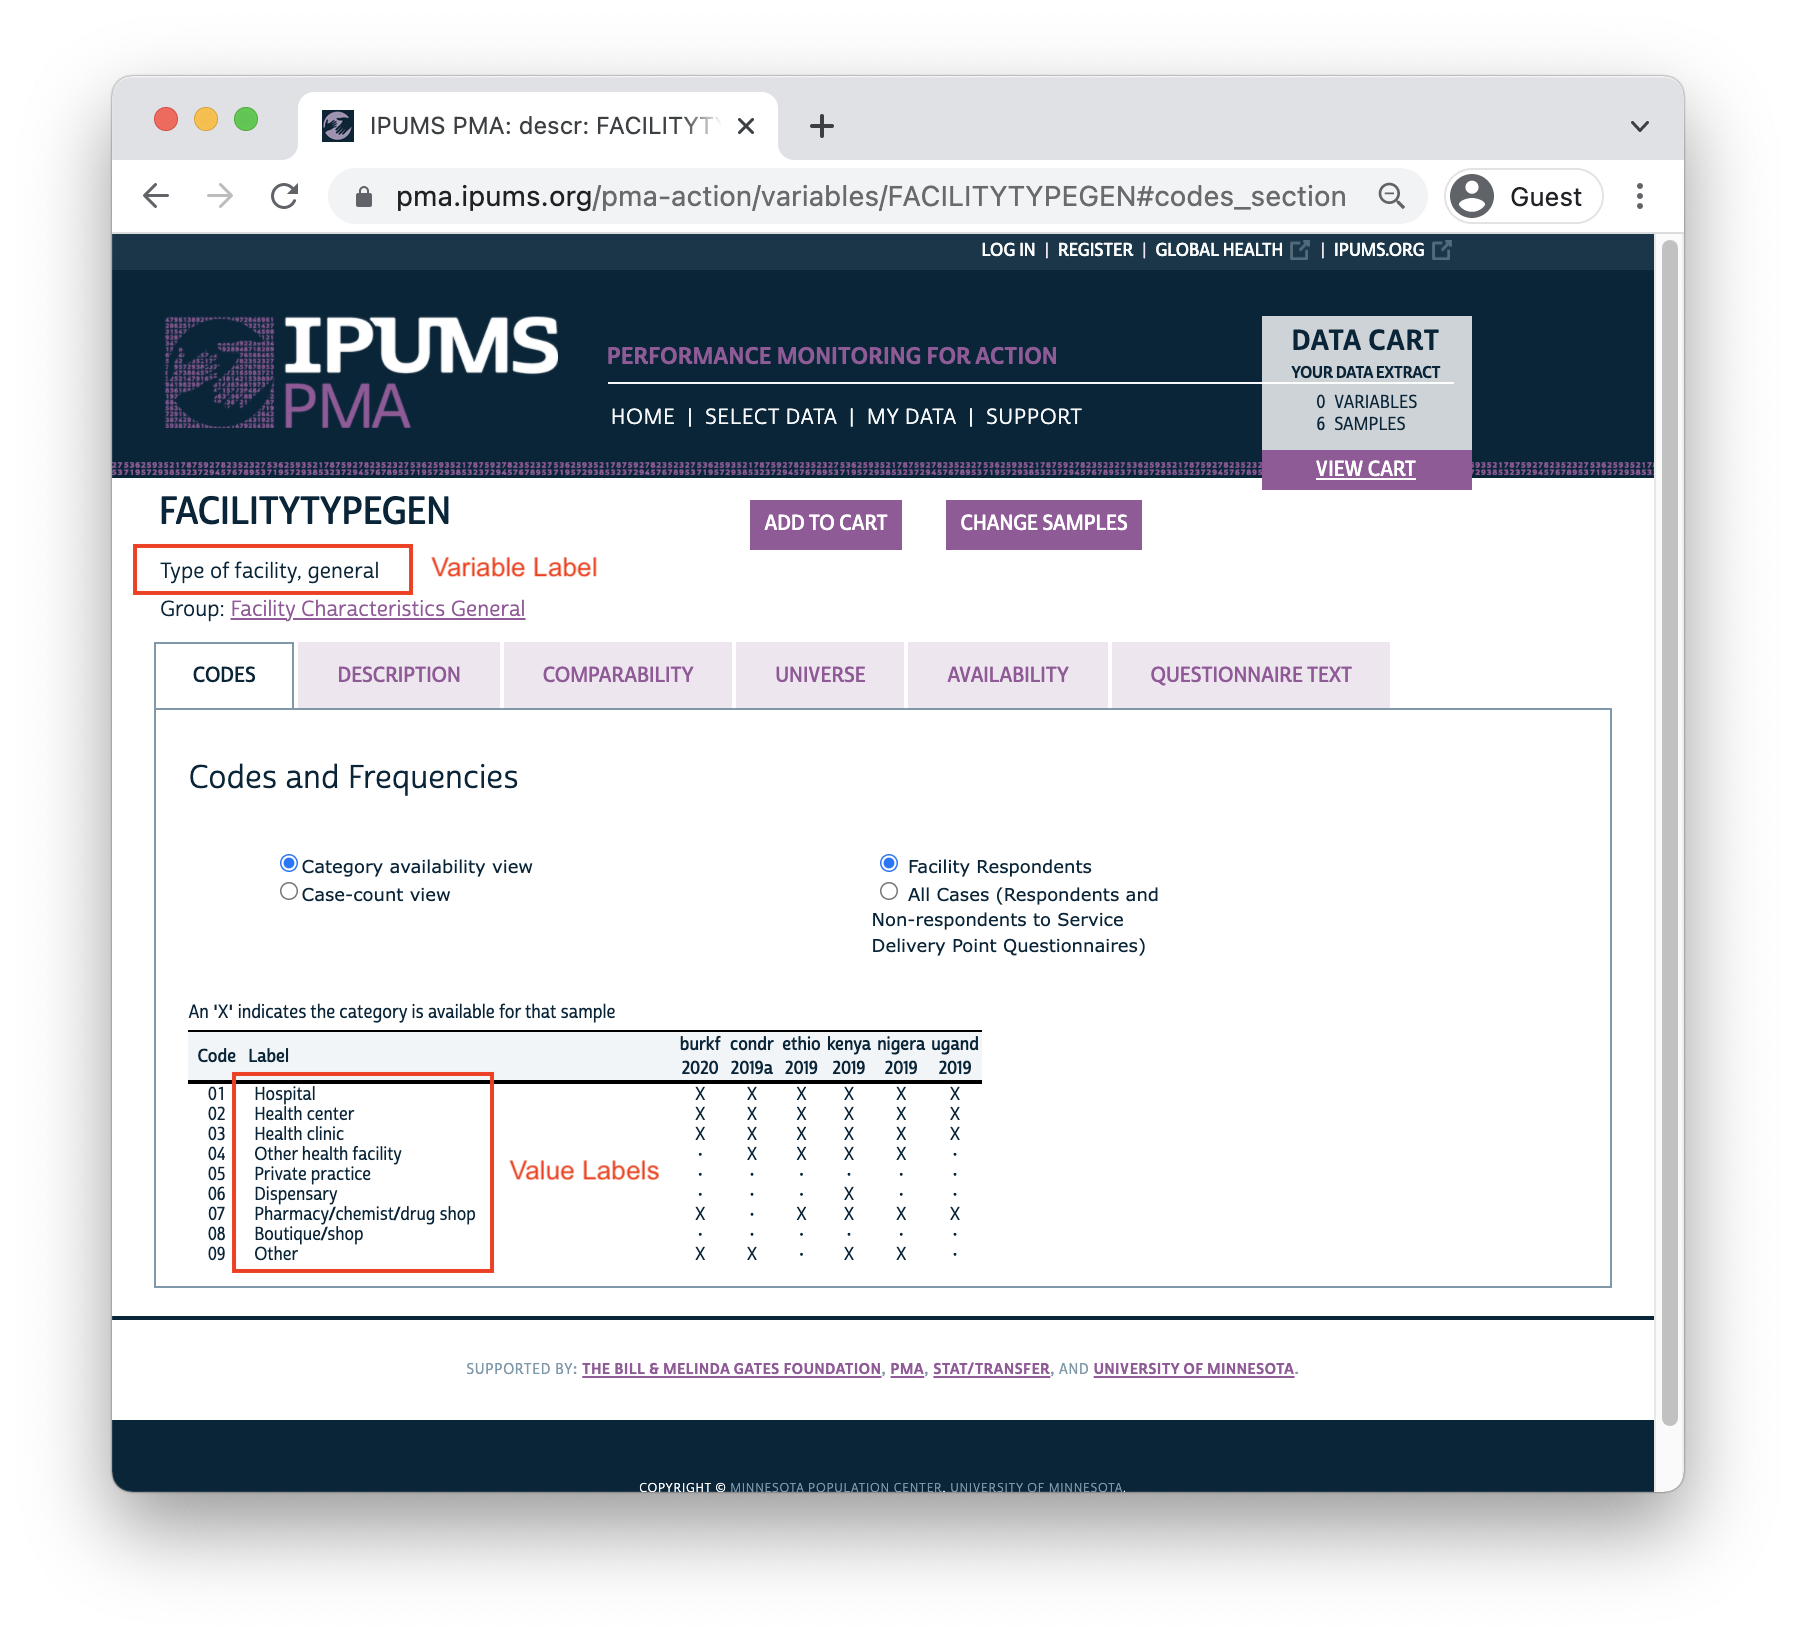
IPUMS labelled data
Almost every post uses the ipumsr package to import an
IPUMS PMA data extract into R. Once loaded, you’ll find that many IPUMS
PMA variables are labelled;
the ipumsr package contains functions for exploring and
manipulating those labels. We’ve shown how to:
- load an IPUMS PMA data extract into R
- recode or label NA values for a particular variable
- convert labelled variables into factors for tables and figures
Iteration with columns
When you want to apply changes to several IPUMS PMA
variables, it’s usually most efficient to leverage the across function from dplyr. We use
across all the time, but some of our best examples show how
to:
- use tidy selection to identify variables by location or a naming pattern
- recode
or label NA values for several variables with tools from
ipumsr - check conditions for multiple variables with if_any and if_all
Iteration with rows
Many functions in R are vectorized: when you apply them to a column in your data frame, you typically get one result for each row.
Non-vectorized functions instead return one
result summarizing the entire column. For instance, the
function mean gives you one mean value derived from all
rows in a given column. Tools from dplyr like rowwise
and group_by
allow us to apply non-vectorized functions to individual rows or groups
of rows. We’ve used these functions to:
- summarize variables within groups
- summarize variables within the same row with c_across
- iterate through groups with help from cur_group
Joining and Reshaping
All of the IPUMS PMA data extracts we’ve examined so far are rectangular in shape: each row represents one person or facility. Sometimes, it’s necessary to change this structure: we might want to spread multiple observations of the same individual into separate rows, or we might want to leverage hierarchical data to situate a person within some larger context (like a household, a region, or a country). With help from data-structuring packages like tidyr, we’ve shown how to:
- merge summary SDP data to records for individual women
- merge baseline and COVID-19 follow up surveys for women in a panel study
- pivot event-history data from a wide to long format and back again
- use nested data structures for individuals grouped by household
Visualization
Whenever we summarize variables or model output on this blog, we like
to make figures with ggplot2 and tables
with gtsummary.
For maps, we’ve focused on ggspatial
- an extension of ggplot2 that supports raster data from
both the raster package
and the terra
package. Topics include:
- designing a
theme for
ggplot2(custom fonts, colors, and layout)
- basic bar charts
- grouped bar charts
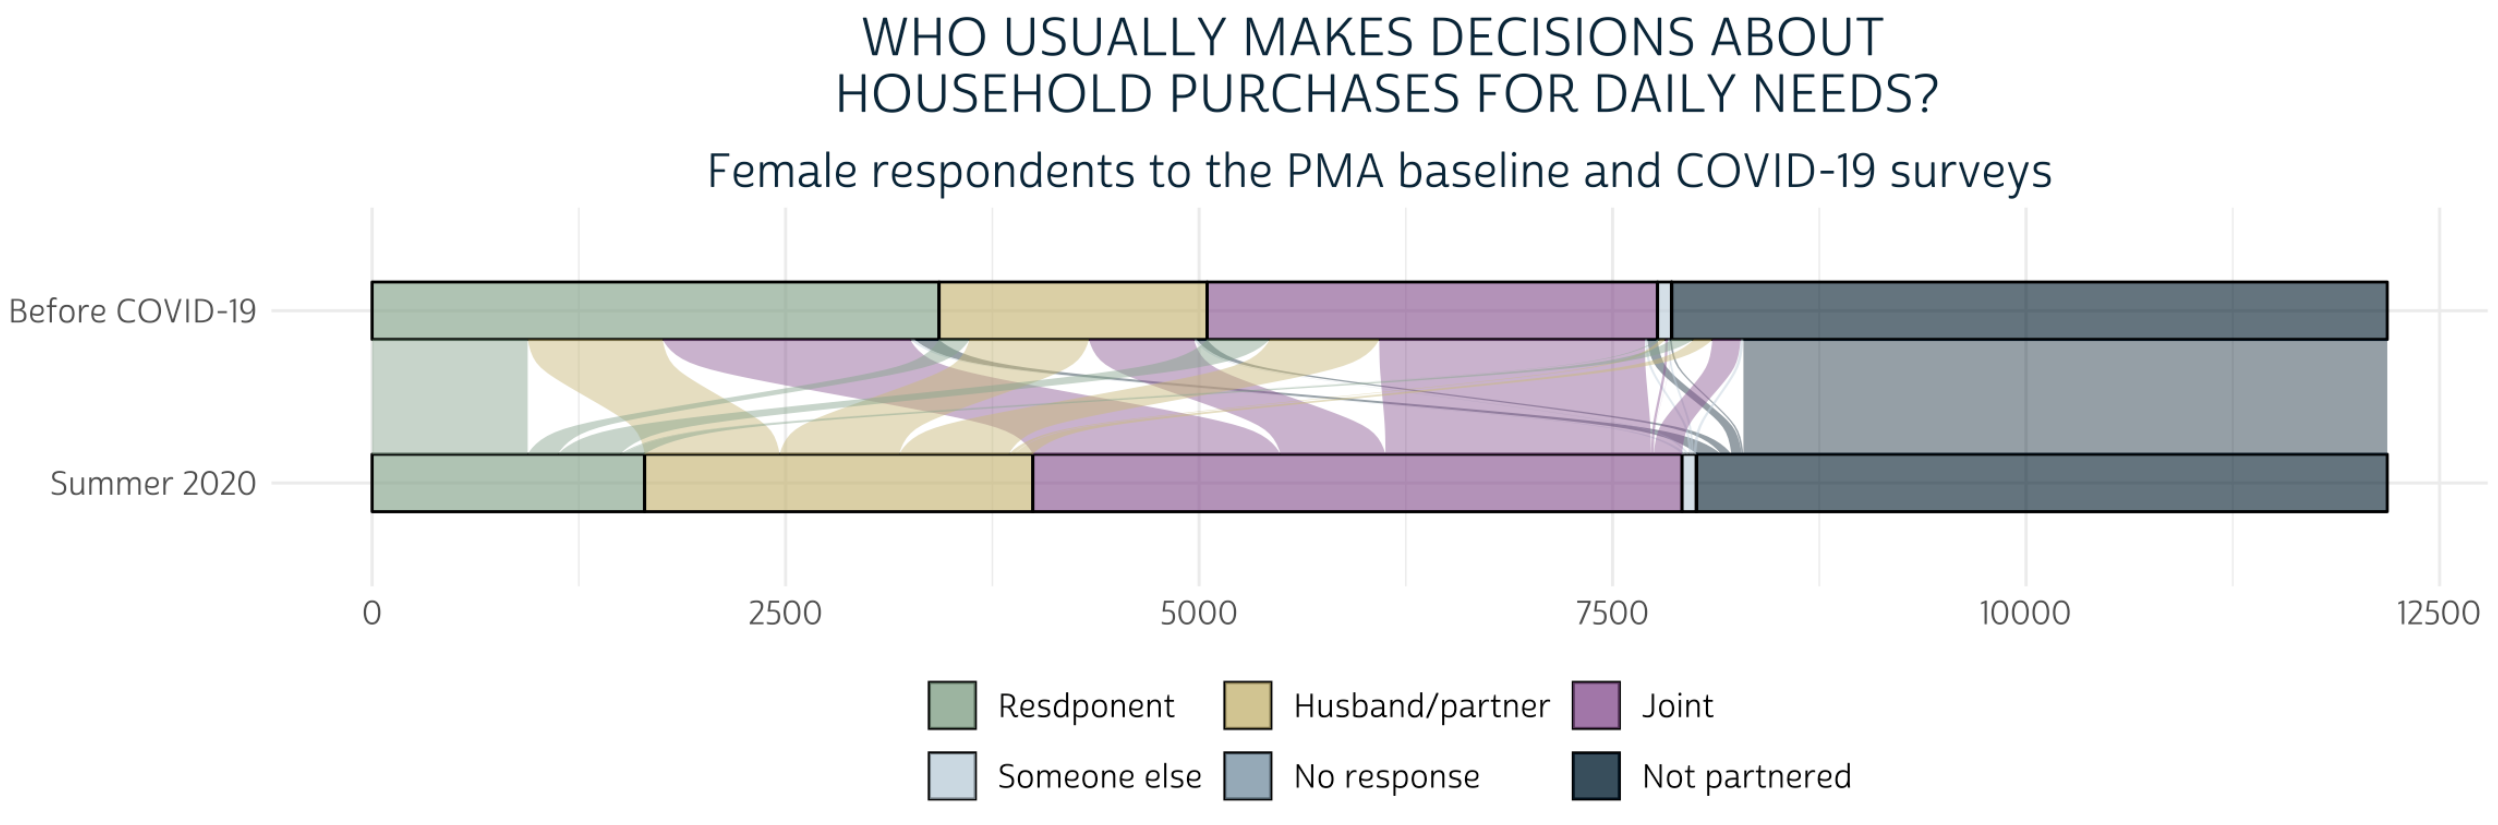
- divergent stacked bar charts
- faceted bar charts
- lollipop charts
- radar charts
- alluvial charts
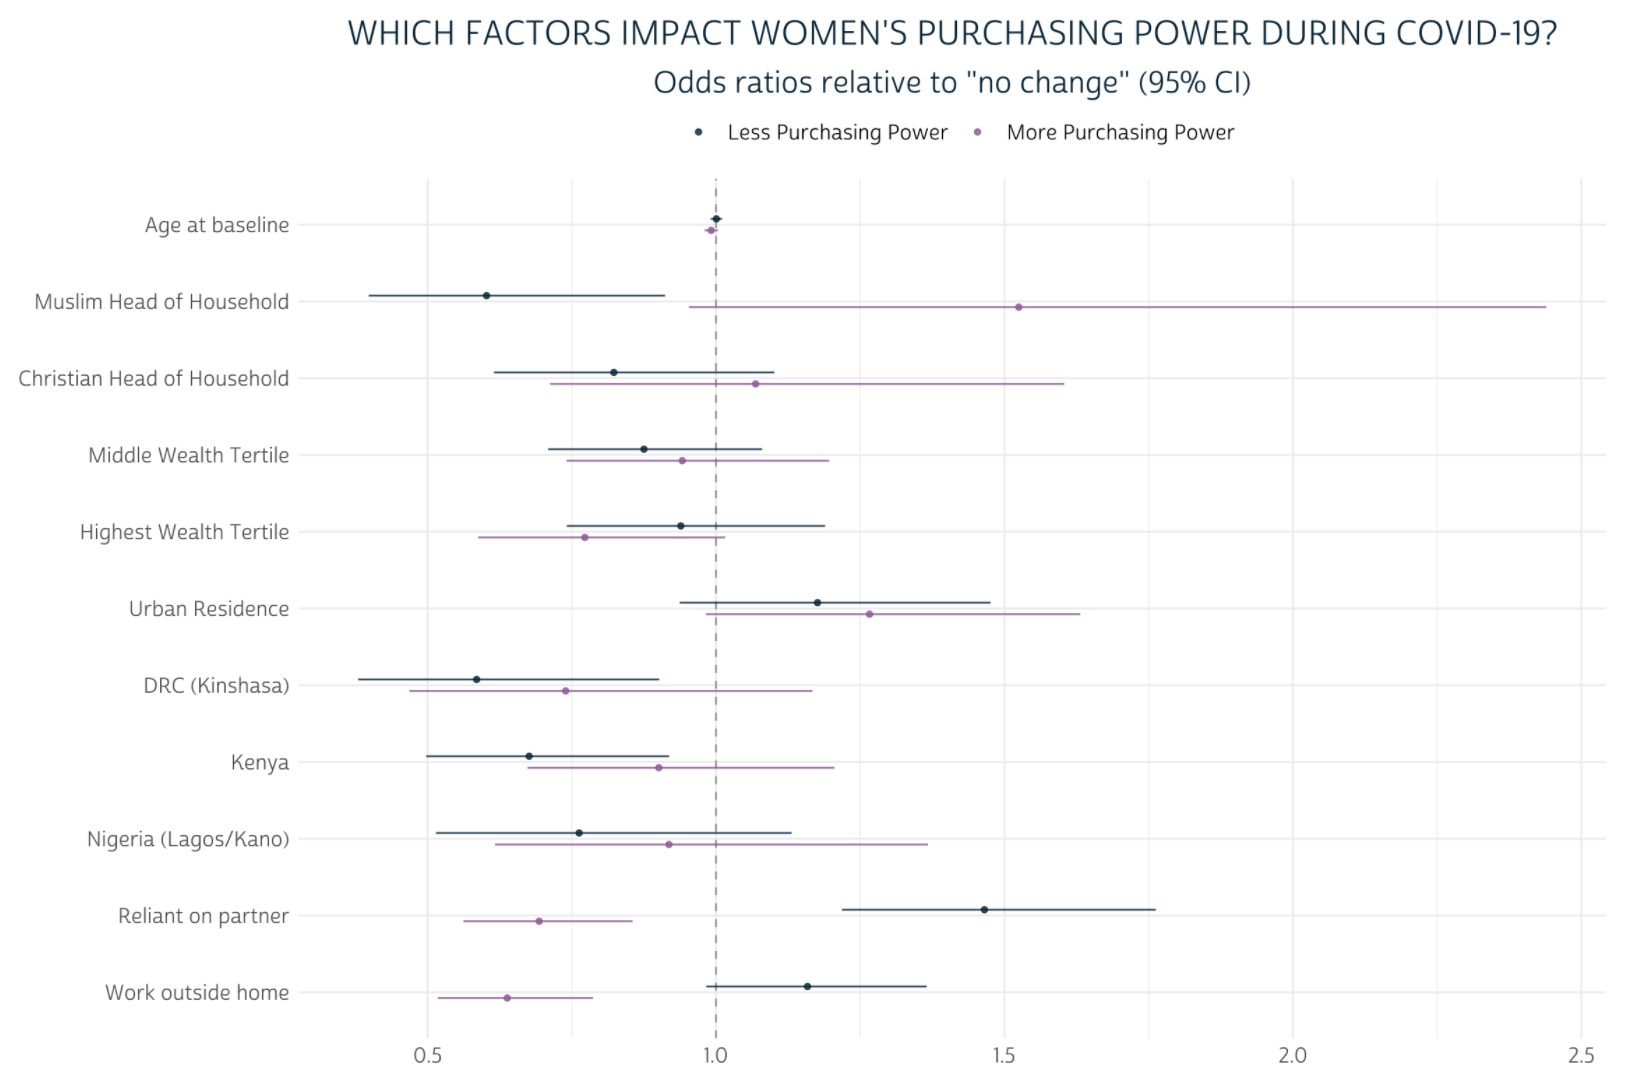
- dot and whisker charts
- error bars and text annotation
- maps
with
ggspatial - descriptive
tables and model summary
tables with
gtsummary
Spatial data
Lastly, we’ve devoted several Data Manipulation posts to exploring external sources for spatial data. If you’re new to spatial data - or if you’re an ArcGIS user interested in learning more about R - we recommend checking out the free, open-source text Geocomputation with R. You’ll be introduced to both of the major packages we use on this blog: sf for vector data and terra for raster data. We’re planning to cover much more spatial content in the coming months, but so far we’ve explained how to:
- find and use PMA GPS coordinates
- find and use IPUMS PMA shapefiles
- create enumeration area buffer zones
- understand and manipulate coordinate reference systems
- merge external vector
data with the
sfpackage - merge external raster data with both the raster package and the newer terra package
Data Analysis
We like to end every series with a Data Analysis post. Here, we use what we’ve learned in earlier posts to build a model and discuss important findings. Often, we’ll use this as an opportunity to showcase new and exciting published research from authors working with PMA data. These posts discuss:
- design elements for the household and female surveys like sample weights and information about cluster sampling
- design elements for COVID-19 follow up surveys
- ordinary
least squares regression
- binary logistic regression
- multinomial models
- multi-level mixed effect models
- survival analysis
- cluster robust standard error estimation
- bootstrapped standard error estimation
Plans for 2022
We’ve been trilled to connect with so many of you - more than 2,000 readers in over 100 countries - in our first year! Coming in the months ahead, we’ll continue providing bi-weekly blog posts covering the latest IPUMS PMA data releases as they become available. We’ve mentioned upcoming series planned for Client Exit Interviews and Round 2 Panel Data, and we’ll also return to the relationship between COVID-19 and family planning in new samples. We plan to continue emphasizing spatial analysis made possible with external data sources, and we’d love to expand our coverage of PMA publications in collaboration with researchers using IPUMS PMA data in their own work. We’re also planning a new course on longitudinal analysis using the first two rounds of PMA panel data; look for new announcements on this in the early spring. And, as always, we’ll continue exploring free and powerful tools for working with survey data in R that we hope will make IPUMS PMA accessible to more researchers than ever before.
Special thanks to all of our outstanding partners at the Bill & Melinda Gates Foundation, Johns Hopkins University, and here at IPUMS for tremendous support as we launched this new project in 2021!
This blog would not be possible without brilliant insight and ongoing encouragement from the whole team at IPUMS PMA: professors Kathryn Grace, Elizabeth Heger Boyle, and Nina Brooks; project director Devon Kristiansen; post-doctoral associates Maya Luetke and Jiao Yu; and graduate research assistants Shelby Rutzick, Saeun Park, and Tayler Nelson who contributed posts this year - thanks to each of you!