In addition to the release of new samples from the service delivery point (SDP) and client exit interview (CEI) data series, this month IPUMS PMA is excited to announce a new feature designed to help researchers study health facilities over time.
Much like the family planning (FP) panel surveys released earlier this year, SDP data are now available in longitudinal format. That means we’ve matched responses from the same facility if it was sampled in multiple rounds of data collection. These responses are organized together in columns numbered separately for up to four rounds - in other words, longitudinal SDP data are organized with one row per facility whether it was sampled once or multiple times.
Let’s cover the new SDP data first, and then we’ll highlight new additions to the companion CEI data series.
New SDP samples
This month’s release includes new SDP samples from eight countries collected between 2020 and 2021. As always, SDP sampling is conducted contemporaneously and in the same enumeration areas used to identify women in households sampled by FP surveys. IPUMS PMA released the contemporaneous FP surveys for each country (except Ethiopia) earlier this year. The new SDP surveys are designed to provide contextual information about the health service environment experienced by women in a corresponding FP sample; later, we will discuss how to match women with nearby facilities via EAID.
| Country | SDP Data Collection | FP Data Collection |
|---|---|---|
| Burkina Faso | Feb 2021 - Mar 2021 | Dec 2020 - Apr 2021 |
| Cote d’Ivoire | Oct 2020 - Nov 2020 | Sep 2020 - Nov 2020 |
| DRC (Kinshasa & Kongo Central) | Jan 2021 - Mar 2021 | Dec 2020 - Mar 2021 |
| Ethiopia | Nov 2020 - Jan 2021 | – |
| India (Rajasthan) | Aug 2020 - Nov 2020 | Aug 2020 - Oct 2020 |
| Kenya | Nov 2020 - Feb 2021 | Nov 2020 - Dec 2020 |
| Nigeria (Kano & Lagos) | Dec 2020 - Jan 2021 | Dec 2020 - Jan 2021 |
| Uganda | Sep 2020 - Oct 2020 | Sep 2020 - Oct 2020 |
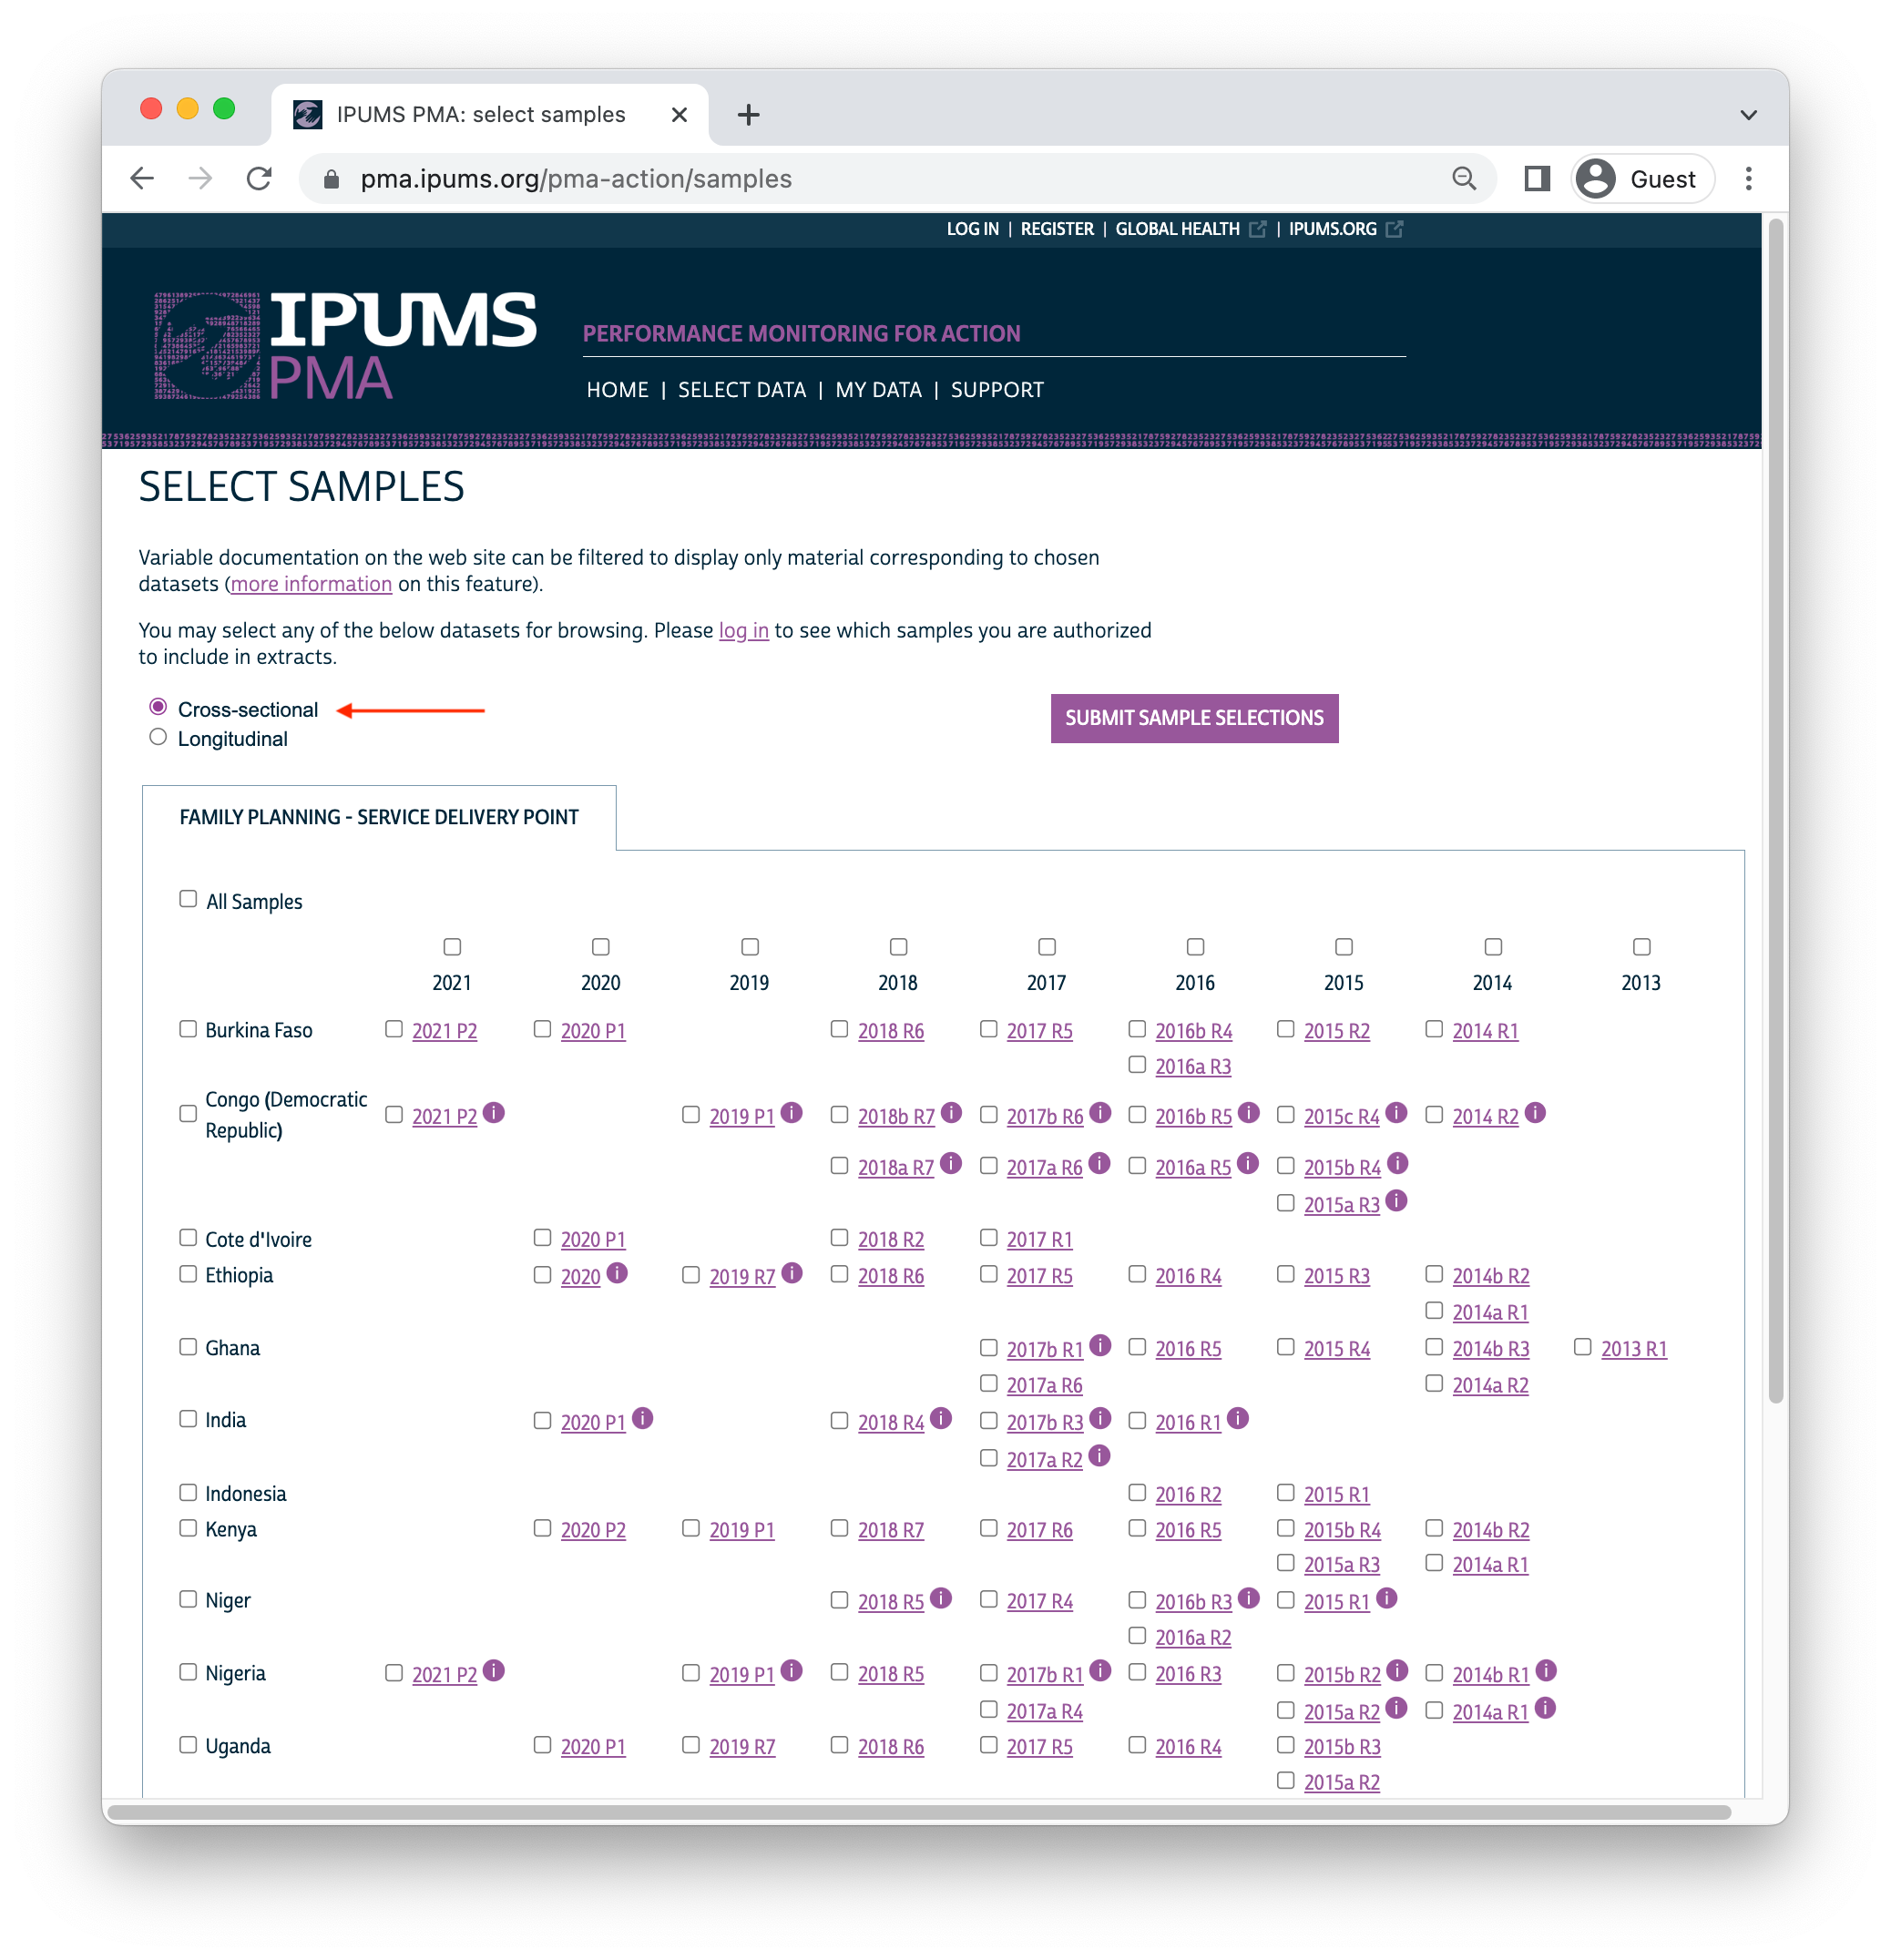
Depending on your needs, you can still download these SDP samples in cross-sectional format. In that case, you’ll find each SDP interview in its own unique row.
With the exception of Ethiopia, all of these new SDP samples are
labelled P1 or P2 to help users match them to
a corresponding “phase” from the ongoing family planning panel study. Data
collection for the third and final phase of the panel study is currently
underway.
Longitudinal SDP data
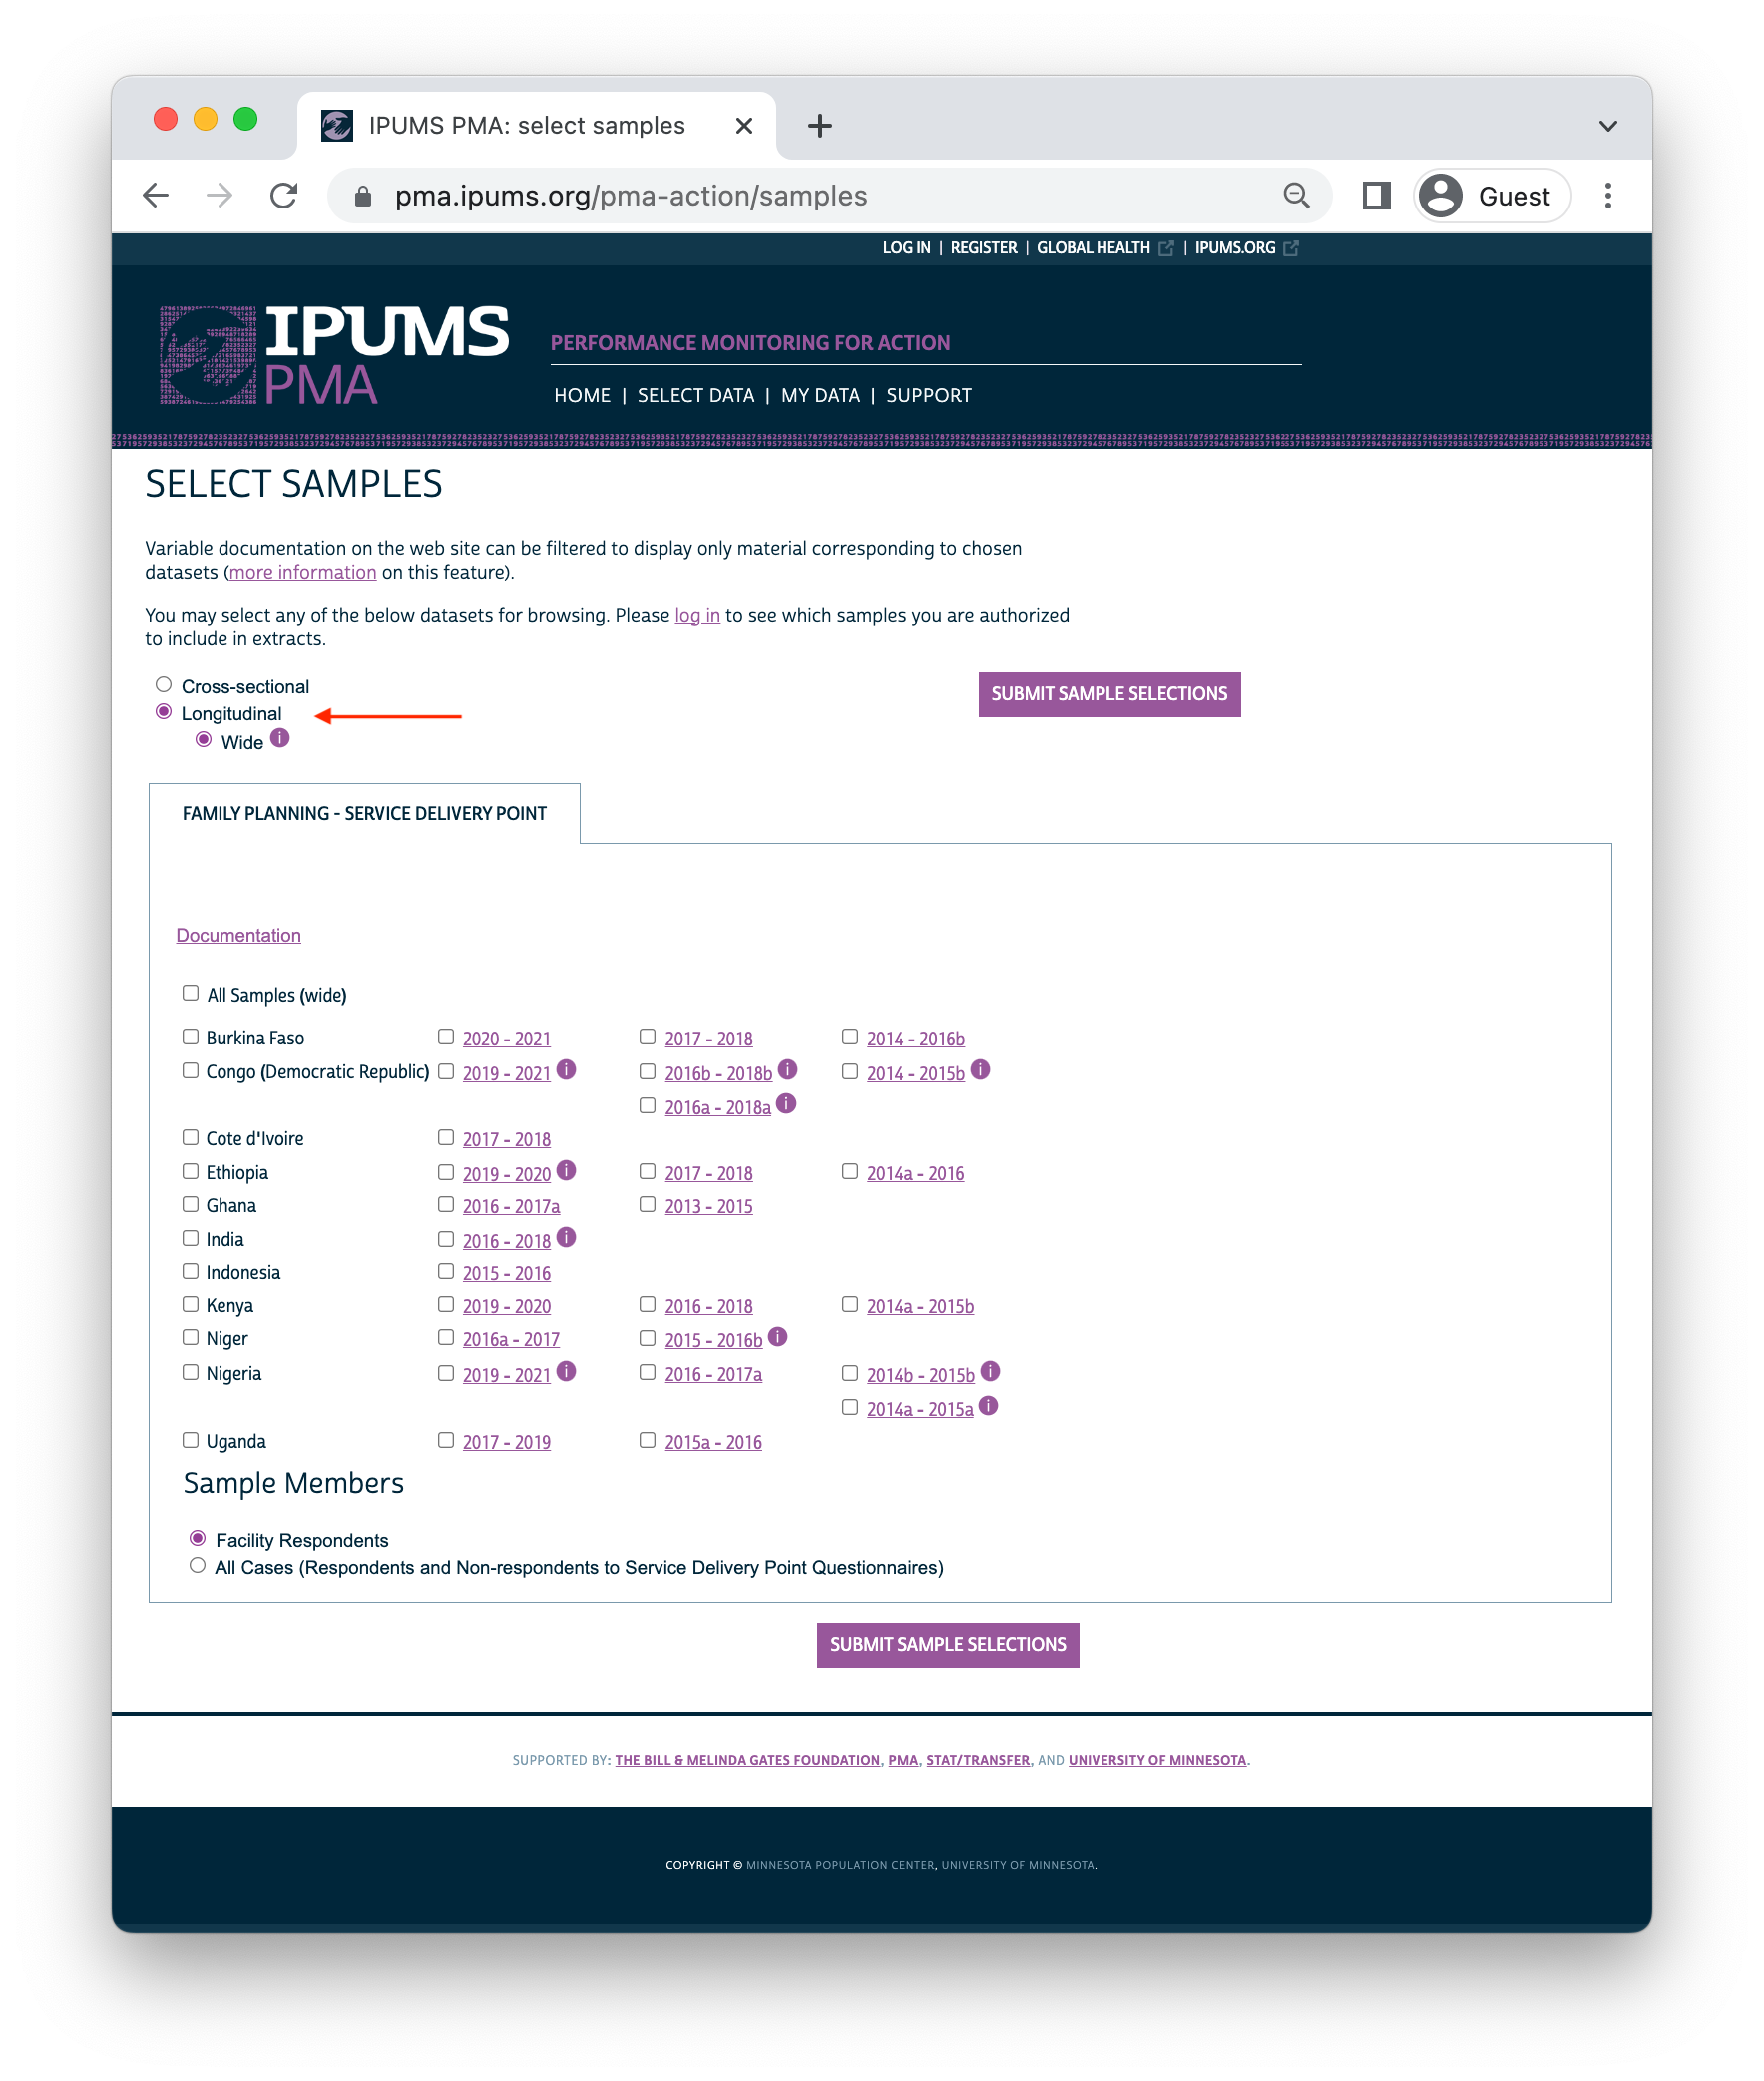
If you select the new longitudinal format, you’ll find SDP samples organized by cohorts, each including up to four rounds of data collection. The same enumeration areas are used in every round within any given cohort, such that the same facility might be sampled from the same enumeration area up to four times in four years.
Format
When you download a longitudinal data extract, you’ll find one unique FACILITYID in each row, regardless of whether the facility was sampled once or multiple times. Here, we’ve created an extract containing all available samples, with “Facility Respondents” only.1 This selects facilities where the SDP interview was fully or partly completed in at least one round of data collection. The first ten records from the first country, Burkina Faso, are shown:
library(ipumsr)
library(tidyverse)

sdp <- read_ipums_micro(
  ddi = "data/pma_00129.xml",
  data = "data/pma_00129.dat.gz"
)

# Use labels as factor levels for the following variables (for readability)
sdp <- sdp %>%
  mutate(
    COUNTRY = as_factor(COUNTRY),
    across(starts_with("RESULT"), as_factor)
  )
sdp %>% select(COUNTRY, FACILITYID, starts_with("RESULT"))
# A tibble: 10,212 × 6
   COUNTRY      FACILITYID RESULTSQ_1 RESULTSQ_2 RESULTSQ_3 RESULTSQ_4
   <fct>        <chr+lbl>  <fct>      <fct>      <fct>      <fct>
 1 Burkina Faso 7298       Completed  Completed  Completed  Completed
 2 Burkina Faso 7399       Completed  Completed  Completed  Completed
 3 Burkina Faso 7627       Completed  Completed  Completed  Completed
 4 Burkina Faso 7596       Completed  Completed  Completed  Completed
 5 Burkina Faso 7316       Completed  Completed  Completed  Completed
 6 Burkina Faso 7559       Completed  Completed  Completed  Completed
 7 Burkina Faso 7989       Completed  Completed  Completed  Completed
 8 Burkina Faso 7502       Completed  Completed  Partly co… Completed
 9 Burkina Faso 7506       Completed  Completed  Completed  Completed
10 Burkina Faso 7837       Completed  Completed  <NA>       <NA>
# … with 10,202 more rows
The variable RESULTSQ
shows the result of the interview for each round of data collection
(numbered _1 through _4). Nine of the first
ten facilities were interviewed four times, but the facility numbered
7837 was only interviewed in rounds 1 and 2. We know that
there is no record for that facility in rounds 3 and 4 because
RESULTSQ
contains the value NA.
Each round of data collection is numbered chronologically, beginning with the earliest round for the cohort. You’ll find the interview year for each round in INTSQYEAR.
sdp %>% select(COUNTRY, FACILITYID, starts_with("INTSQYEAR"))
# A tibble: 10,212 × 6
   COUNTRY  FACILITYID INTSQYEAR_1 INTSQYEAR_2 INTSQYEAR_3 INTSQYEAR_4
   <fct>    <chr+lbl>    <int+lbl>   <int+lbl>   <int+lbl>   <int+lbl>
 1 Burkina… 7298              2014        2015        2016        2016
 2 Burkina… 7399              2014        2015        2016        2017
 3 Burkina… 7627              2014        2015        2016        2016
 4 Burkina… 7596              2014        2015        2016        2017
 5 Burkina… 7316              2014        2015        2016        2017
 6 Burkina… 7559              2014        2015        2016        2017
 7 Burkina… 7989              2014        2015        2016        2016
 8 Burkina… 7502              2014        2015        2016        2016
 9 Burkina… 7506              2014        2015        2016        2016
10 Burkina… 7837              2014        2015          NA          NA
# … with 10,202 more rowsEach of these ten facilities are members of the same cohort from Burkina Faso, representing samples collected between 2014 and early 2017. IPUMS has created a unique ID for each cohort in the new variable SDPCOHORT. You can obtain a count of the total number of facilities included across all rounds for each cohort like so:
# A tibble: 26 × 3
   COUNTRY                    SDPCOHORT     n
   <fct>                          <dbl> <int>
 1 Burkina Faso                   85401   160
 2 Burkina Faso                   85402   149
 3 Burkina Faso                   85403   247
 4 Congo, Democratic Republic     18001   547
 5 Congo, Democratic Republic     18002   382
 6 Congo, Democratic Republic     18003   234
 7 Congo, Democratic Republic     18004   427
 8 Ethiopia                       23101   570
 9 Ethiopia                       23102   500
10 Ethiopia                       23103   114
# … with 16 more rows
Or, you can group_by these variables and use summarise to obtain the total number of facilities interviewed for each round:
sdp %>%
  group_by(COUNTRY, SDPCOHORT) %>%
  summarise(across(
    starts_with("RESULTSQ"),
    ~sum(!is.na(.x))
  ))
# A tibble: 26 × 6
# Groups:   COUNTRY [11]
   COUNTRY       SDPCOHORT RESULTSQ_1 RESULTSQ_2 RESULTSQ_3 RESULTSQ_4
   <fct>             <dbl>      <int>      <int>      <int>      <int>
 1 Burkina Faso      85401        106        103        133        131
 2 Burkina Faso      85402        130         98          0          0
 3 Burkina Faso      85403        234        244          0          0
 4 Congo, Democ…     18001        248        245        226          0
 5 Congo, Democ…     18002        171        175        186          0
 6 Congo, Democ…     18003        102        115        124          0
 7 Congo, Democ…     18004        356        375          0          0
 8 Ethiopia          23101        389        400        440        455
 9 Ethiopia          23102        442        470          0          0
10 Ethiopia          23103        111         85          0          0
# … with 16 more rowsIndividual facilities may enter or exit their cohort any number of times. For example, it is possible that a facility might complete the SDP interview once in round one, skip round two, and then re-enter the same cohort again in round three:
sdp %>%
  select(COUNTRY, SDPCOHORT, FACILITYID, starts_with("RESULTSQ")) %>%
  filter(!is.na(RESULTSQ_1) & is.na(RESULTSQ_2) & !is.na(RESULTSQ_3))
# A tibble: 95 × 7
   COUNTRY       SDPCOHORT FACILITYID RESULTSQ_1 RESULTSQ_2 RESULTSQ_3
   <fct>             <dbl> <chr+lbl>  <fct>      <fct>      <fct>
 1 Burkina Faso      85401 7229       Completed  <NA>       Completed
 2 Congo, Democ…     18001 5043       Completed  <NA>       Completed
 3 Congo, Democ…     18001 5082       Completed  <NA>       Completed
 4 Congo, Democ…     18001 5072       Completed  <NA>       Completed
 5 Congo, Democ…     18001 5688       Completed  <NA>       Completed
 6 Congo, Democ…     18001 5355       Completed  <NA>       Completed
 7 Congo, Democ…     18001 5481       Completed  <NA>       Completed
 8 Congo, Democ…     18001 5758       Completed  <NA>       Completed
 9 Congo, Democ…     18001 5649       Completed  <NA>       Completed
10 Congo, Democ…     18001 5112       Completed  <NA>       Completed
# … with 85 more rows, and 1 more variable: RESULTSQ_4 <fct>Also, a facility may enter the cohort after round one.
sdp %>%
  select(COUNTRY, SDPCOHORT, FACILITYID, starts_with("RESULTSQ")) %>%
  filter(is.na(RESULTSQ_1) & !is.na(RESULTSQ_2))
# A tibble: 1,892 × 7
   COUNTRY      SDPCOHORT FACILITYID RESULTSQ_1 RESULTSQ_2 RESULTSQ_3
   <fct>            <dbl> <chr+lbl>  <fct>      <fct>      <fct>
 1 Burkina Faso     85401 7256       <NA>       Completed  <NA>
 2 Burkina Faso     85401 7133       <NA>       Completed  <NA>
 3 Burkina Faso     85402 7840       <NA>       Completed  <NA>
 4 Burkina Faso     85402 7523       <NA>       Completed  <NA>
 5 Burkina Faso     85402 7941       <NA>       Completed  <NA>
 6 Burkina Faso     85402 7434       <NA>       Completed  <NA>
 7 Burkina Faso     85402 7786       <NA>       Completed  <NA>
 8 Burkina Faso     85402 7280       <NA>       Completed  <NA>
 9 Burkina Faso     85402 7135       <NA>       Completed  <NA>
10 Burkina Faso     85402 7854       <NA>       Completed  <NA>
# … with 1,882 more rows, and 1 more variable: RESULTSQ_4 <fct>However, each FACILITYID appears in only one cohort. In the event that a facility is randomly selected into multiple cohorts, it would receive a new FACILITYID. It is not possible to reliably match these facilities across cohorts.
# A tibble: 1 × 2
  cohort_appearences     n
               <int> <int>
1 1 10212Lastly, users should note that in some instances, the same FACILITYID was listed in a different enumeration area in one or more rounds. This occurs in less than 4% of cases across cohorts.
sdp %>%
  select(COUNTRY, SDPCOHORT, FACILITYID, starts_with("EAID")) %>%
  pivot_longer(starts_with("EAID"), values_to = "EAID") %>%
  group_by(COUNTRY, SDPCOHORT, FACILITYID) %>%
  summarise(ea_count = n_distinct(EAID, na.rm = TRUE), .groups = "keep") %>%
  ungroup() %>%
  count(ea_count > 1) %>%
  mutate(prop = prop.table(n))
# A tibble: 2 × 3
  `ea_count > 1`     n   prop
  <lgl>          <int>  <dbl>
1 FALSE           9824 0.962
2 TRUE 388 0.0380Data Availability
We’ve seen that the value NA is used to represent
facilities that were interviewed fewer than four times in the
same cohort: if, for example, no interview data exists for round 4, all
variables named with the suffix _4 are marked
NA.
However, there is is second reason why you might see NA
values in a longitudinal data extract. These represent cases where the
question associated with a particular variable was changed or omitted
between rounds. For example, let’s take a look at contraceptive
stock variable group:
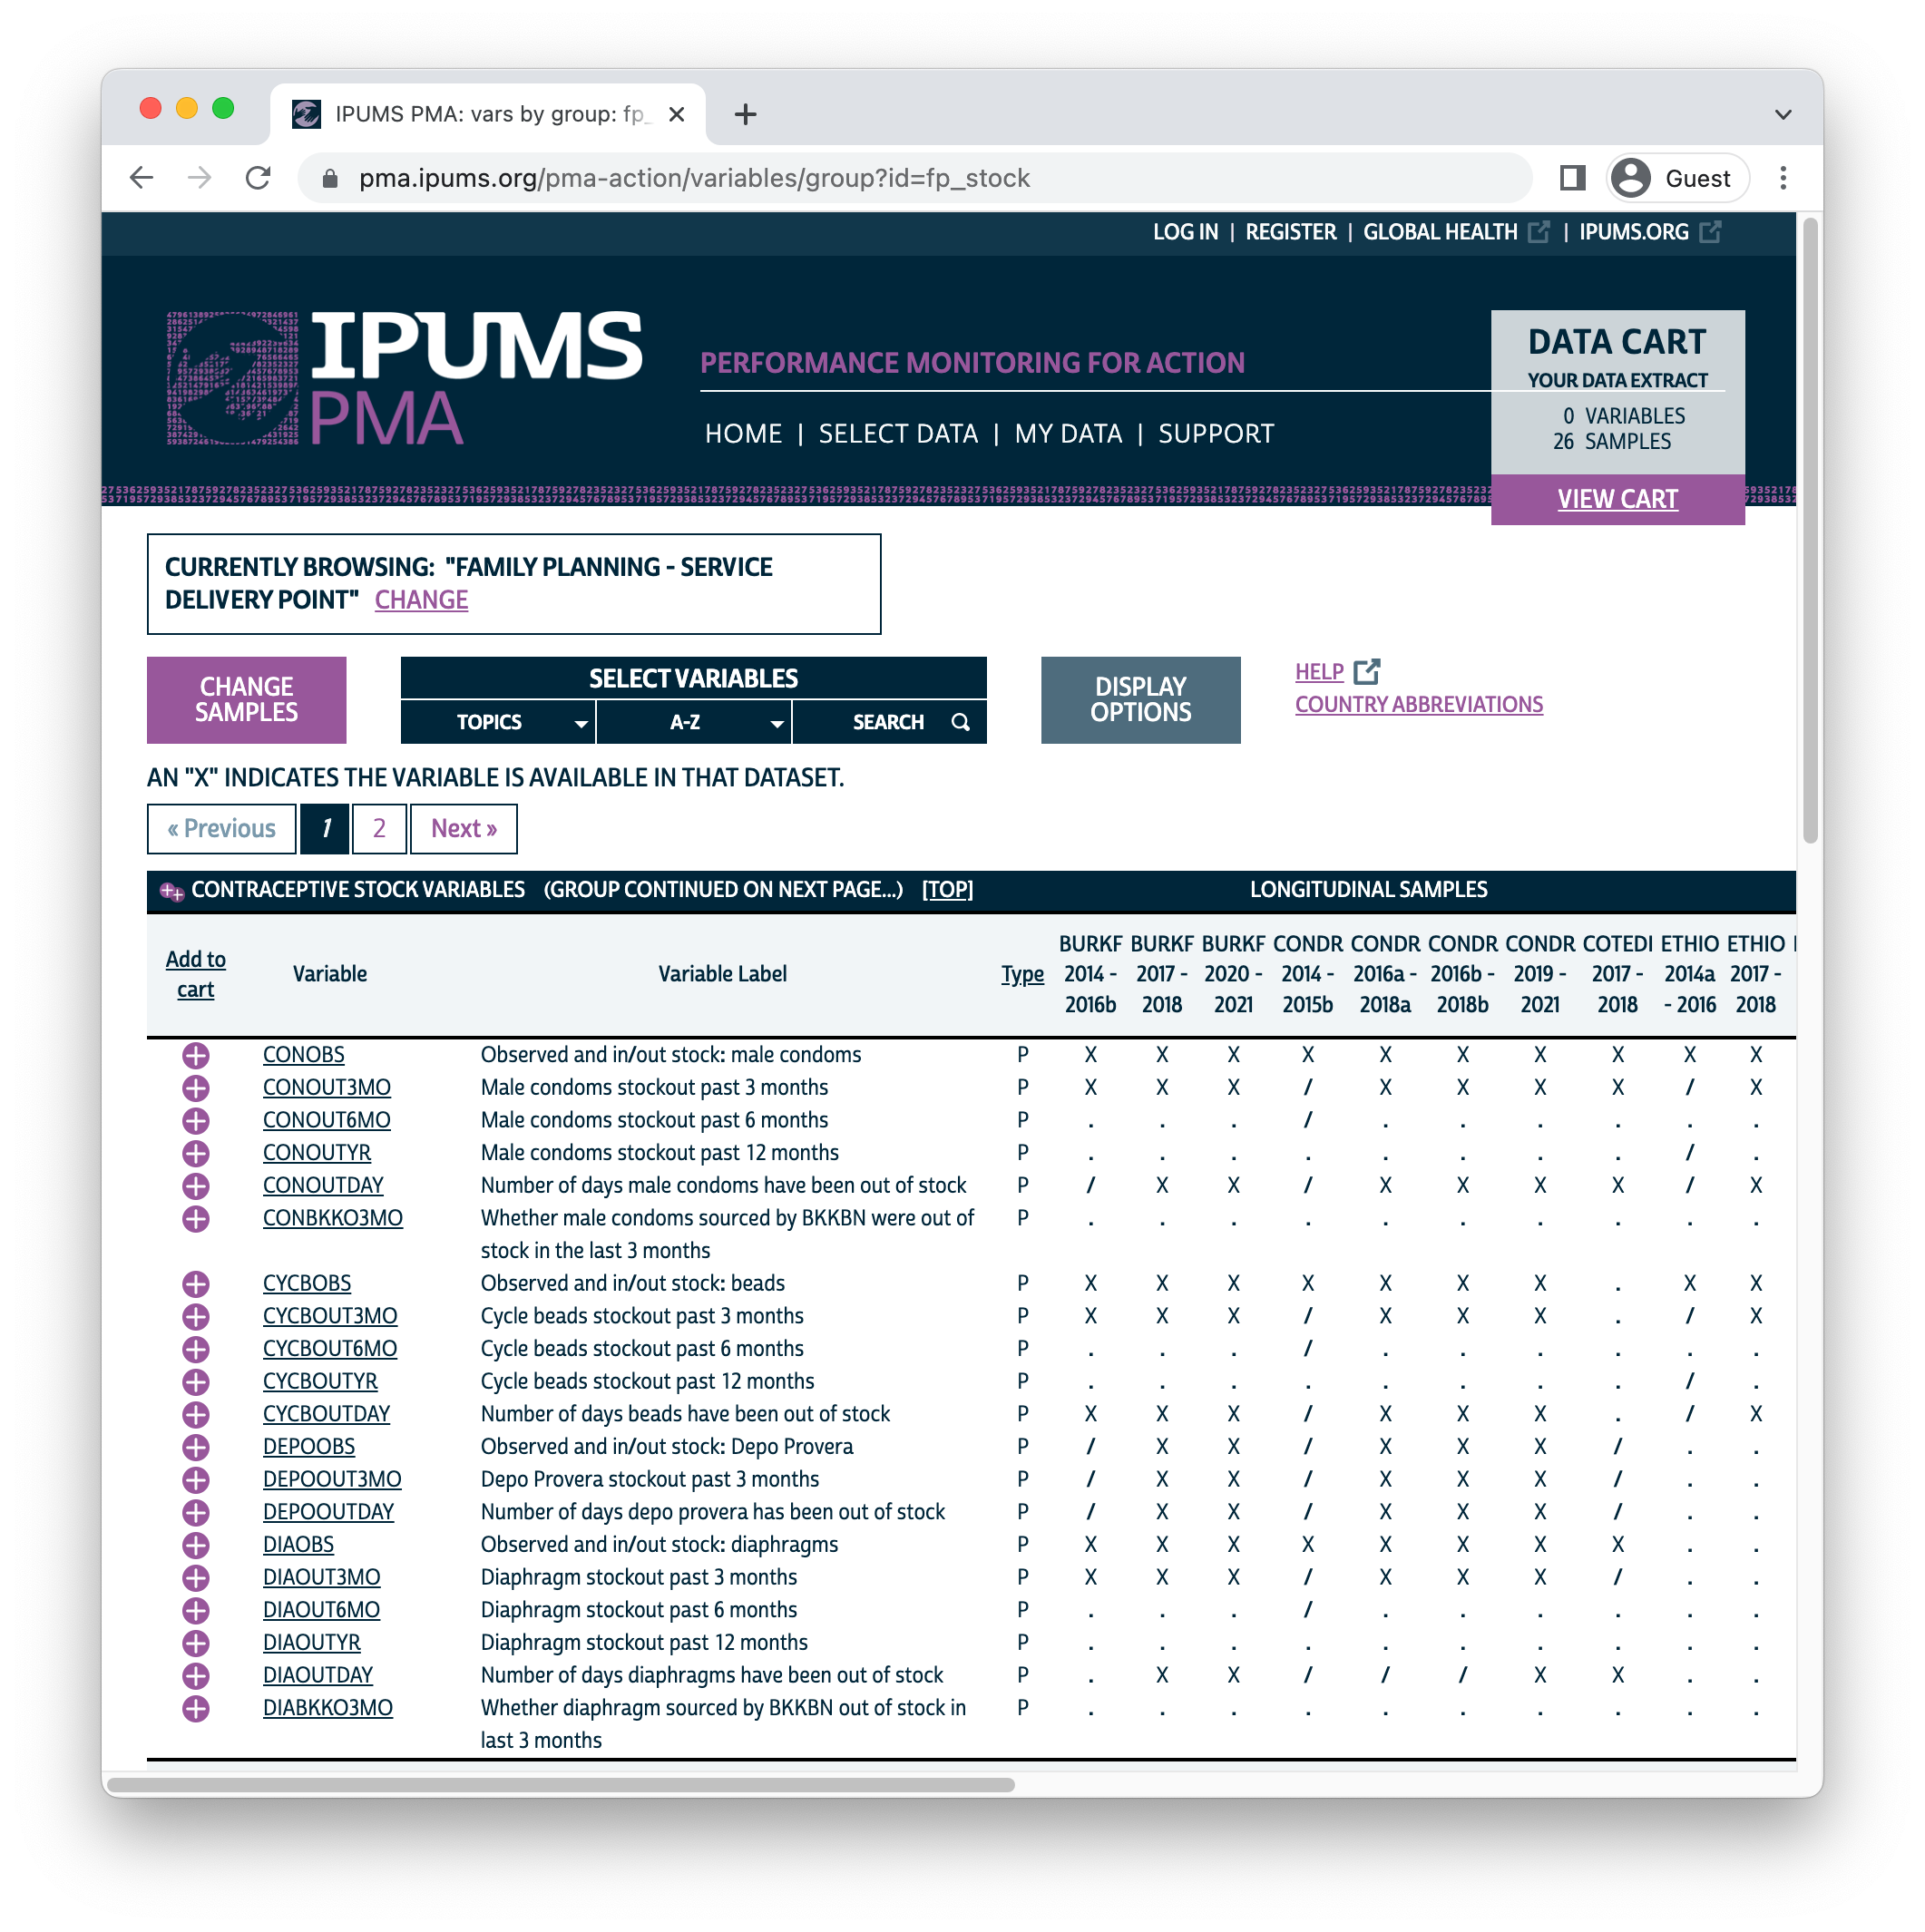
Certain contraceptive methods are included in every questionnaire ever administered across SDP samples, and every sample includes a question asking whether certain methods were in-stock and observed by the interviewer. So, you’ll always find the following variables available across samples:
- CONOBS - male condoms
- EMRGOBS - emergency contraception
- FCOBS - female condoms
- IMPOBS - contraceptive implants
- IUDOBS - IUDs
- PILLOBS - contraceptive pills
However, some questionnaires ask about the availability of additional contraceptive methods. As a result, some samples contain additional variables like:
- CYCBOBS - Standard Days / Cycle Beads
- DEPOOBS - Depo Provera
- DIAOBS - diaphragms
- FJOBS - contraceptive foam / jelly
- INJ1OBS - 1 month injectables
- INJ3OBS - 3 month injectables
- MIFEOBS - mifepristone
- MISOBS - misoprostol
- NTABOBS - N-tablets
- OTHEROBS - other methods
- PROPILLOBS - Progestin pills
- SAYOBS - Sayana Press
When you download an extract containing multiple samples, these
variables will contain NA values for samples that did not
ask about the availability of these additional methods.
Fortunately, in a longitudinal extract you’ll find that the same
OBS variables are always available for all rounds
within the same cohort. PMA might add or drop contraceptive methods
from the questionnaire administered in a particular country, but
only during a redesign period before the selection of a new
cohort.
You’ll can see this for yourself if you count the number of responses
to all of the OBS variables and compare this to the number
of facilities that completed all or part of the interview across rounds.
We’ll use pivot_longer
to showcase these counts in separate rows for each round:
sdp %>%
  group_by(COUNTRY, SDPCOHORT) %>%
  summarise(
    across(matches("OBS") | matches("RESULT"), ~sum(!is.na(.x))),
    .groups = "keep"
  ) %>%
  pivot_longer(
    -c(COUNTRY, SDPCOHORT),
    names_pattern = "(.*)_(.*)",
    names_to = c(".value", "ROUND")
  ) %>%
  relocate(RESULTSQ, .after = ROUND) %>%
  filter(RESULTSQ != 0)
# A tibble: 68 × 23
# Groups:   COUNTRY, SDPCOHORT [26]
   COUNTRY      SDPCOHORT ROUND RESULTSQ CONOBS CYCBOBS DEPOOBS DIAOBS
   <fct>            <dbl> <chr>    <int>  <int>   <int>   <int>  <int>
 1 Burkina Faso     85401 1          106    106     106       0    106
 2 Burkina Faso     85401 2          103    103     103       0    103
 3 Burkina Faso     85401 3          133    133     133       0    133
 4 Burkina Faso     85401 4          131    131     131       0    131
 5 Burkina Faso     85402 1          130    130     130     130    130
 6 Burkina Faso     85402 2           98     98      98      98     98
 7 Burkina Faso     85403 1          234    234     234     234    234
 8 Burkina Faso     85403 2          244    244     244     244    244
 9 Congo, Demo…     18001 1          248    248     248       0    248
10 Congo, Demo…     18001 2          245    245     245       0    245
# … with 58 more rows, and 15 more variables: EMRGOBS <int>,
#   FCOBS <int>, FJOBS <int>, IMPOBS <int>, INJOBS <int>,
#   INJ1OBS <int>, INJ3OBS <int>, IUDOBS <int>, NTABOBS <int>,
#   OTHEROBS <int>, PILLOBS <int>, PROPILLOBS <int>, SAYOBS <int>,
#   MIFEOBS <int>, MISOBS <int>
Again, let’s focus our attention on the first cohort numbered
85401 from Burkina Faso, which includes data collected in
four rounds. In the first round, 106 facilities completed all or part of
the questionnaire (RESULTSQ),
and every one of those facilities answered a question about
contraceptive stock. That question included male condoms (CONOBS),
beads (CYCBOBS),
diaphragms (DEPOOBS),
and more. However, it did not ask about Depo Provera, which is why DEPOOBS
shows zero non-NA values.
Moving downward, you see that DEPOOBS
shows zero non-NA values in every round for cohort
85401. That’s because the associated question was not
modified until the redesign period following round four.
Then, a new cohort numbered 85402 was drawn from a new
set of enumeration areas, and the questionnaire was adjusted to include
Depo Provera. No further adjustments were made after round one was
completed for cohort 85402: Depo Provera appears again in
the second and final round.
If you were to continue exploring this table, you would find that the
value 0 appears consistently for all variables in all
rounds for any given cohort.
Applications
In the coming weeks, we’ll continue exploring longitudinal SDP data as a way to understand how facilities adapt in response to shifting markets, policies, and even climate conditions. However, we urge users to remember that SDP surveys are not collected through random sampling: they should not be used to estimate population-level statistics for health service providers on a national or sub-national scale.
Instead, we’ll show how to use SDP data as contextual information for women and households sampled in PMA family planning surveys. That’s because SDP samples are constructed to include up to three public-sector and three private-sector facilities serving each enumeration area included in a contemporaneous family planning sample. SDP data are intended to represent the health service environment experienced by the women included in these samples.
New CEI data
CEI surveys are a relatively new addition to PMA, so you’ll find samples available from 2020 onward. They represent interviews with actual clients visiting facilities included in a contemporaneous SDP sample. These clients are women from the community who sought family planning services or products at the facility during a two-day data collection period.
This data release includes CEI samples corresponding with many of the same SDP samples we mentioned above:
| Country | SDP Data Collection | CEI Data Collection |
|---|---|---|
| Burkina Faso | Feb 2021 - Mar 2021 | Feb 2021 - Mar 2021 |
| Cote d’Ivoire | Oct 2020 - Nov 2020 | Oct 2020 - Nov 2020 |
| DRC (Kinshasa & Kongo Central) | Jan 2021 - Mar 2021 | Feb 2021 - Mar 2021 |
| Ethiopia | Nov 2020 - Jan 2021 | – |
| India (Rajasthan) | Aug 2020 - Nov 2020 | – |
| Kenya | Nov 2020 - Feb 2021 | Dec 2020 - Mar 2021 |
| Nigeria (Kano & Lagos) | Dec 2020 - Jan 2021 | Dec 2020 - Jan 2021 |
| Uganda | Sep 2020 - Oct 2020 | – |
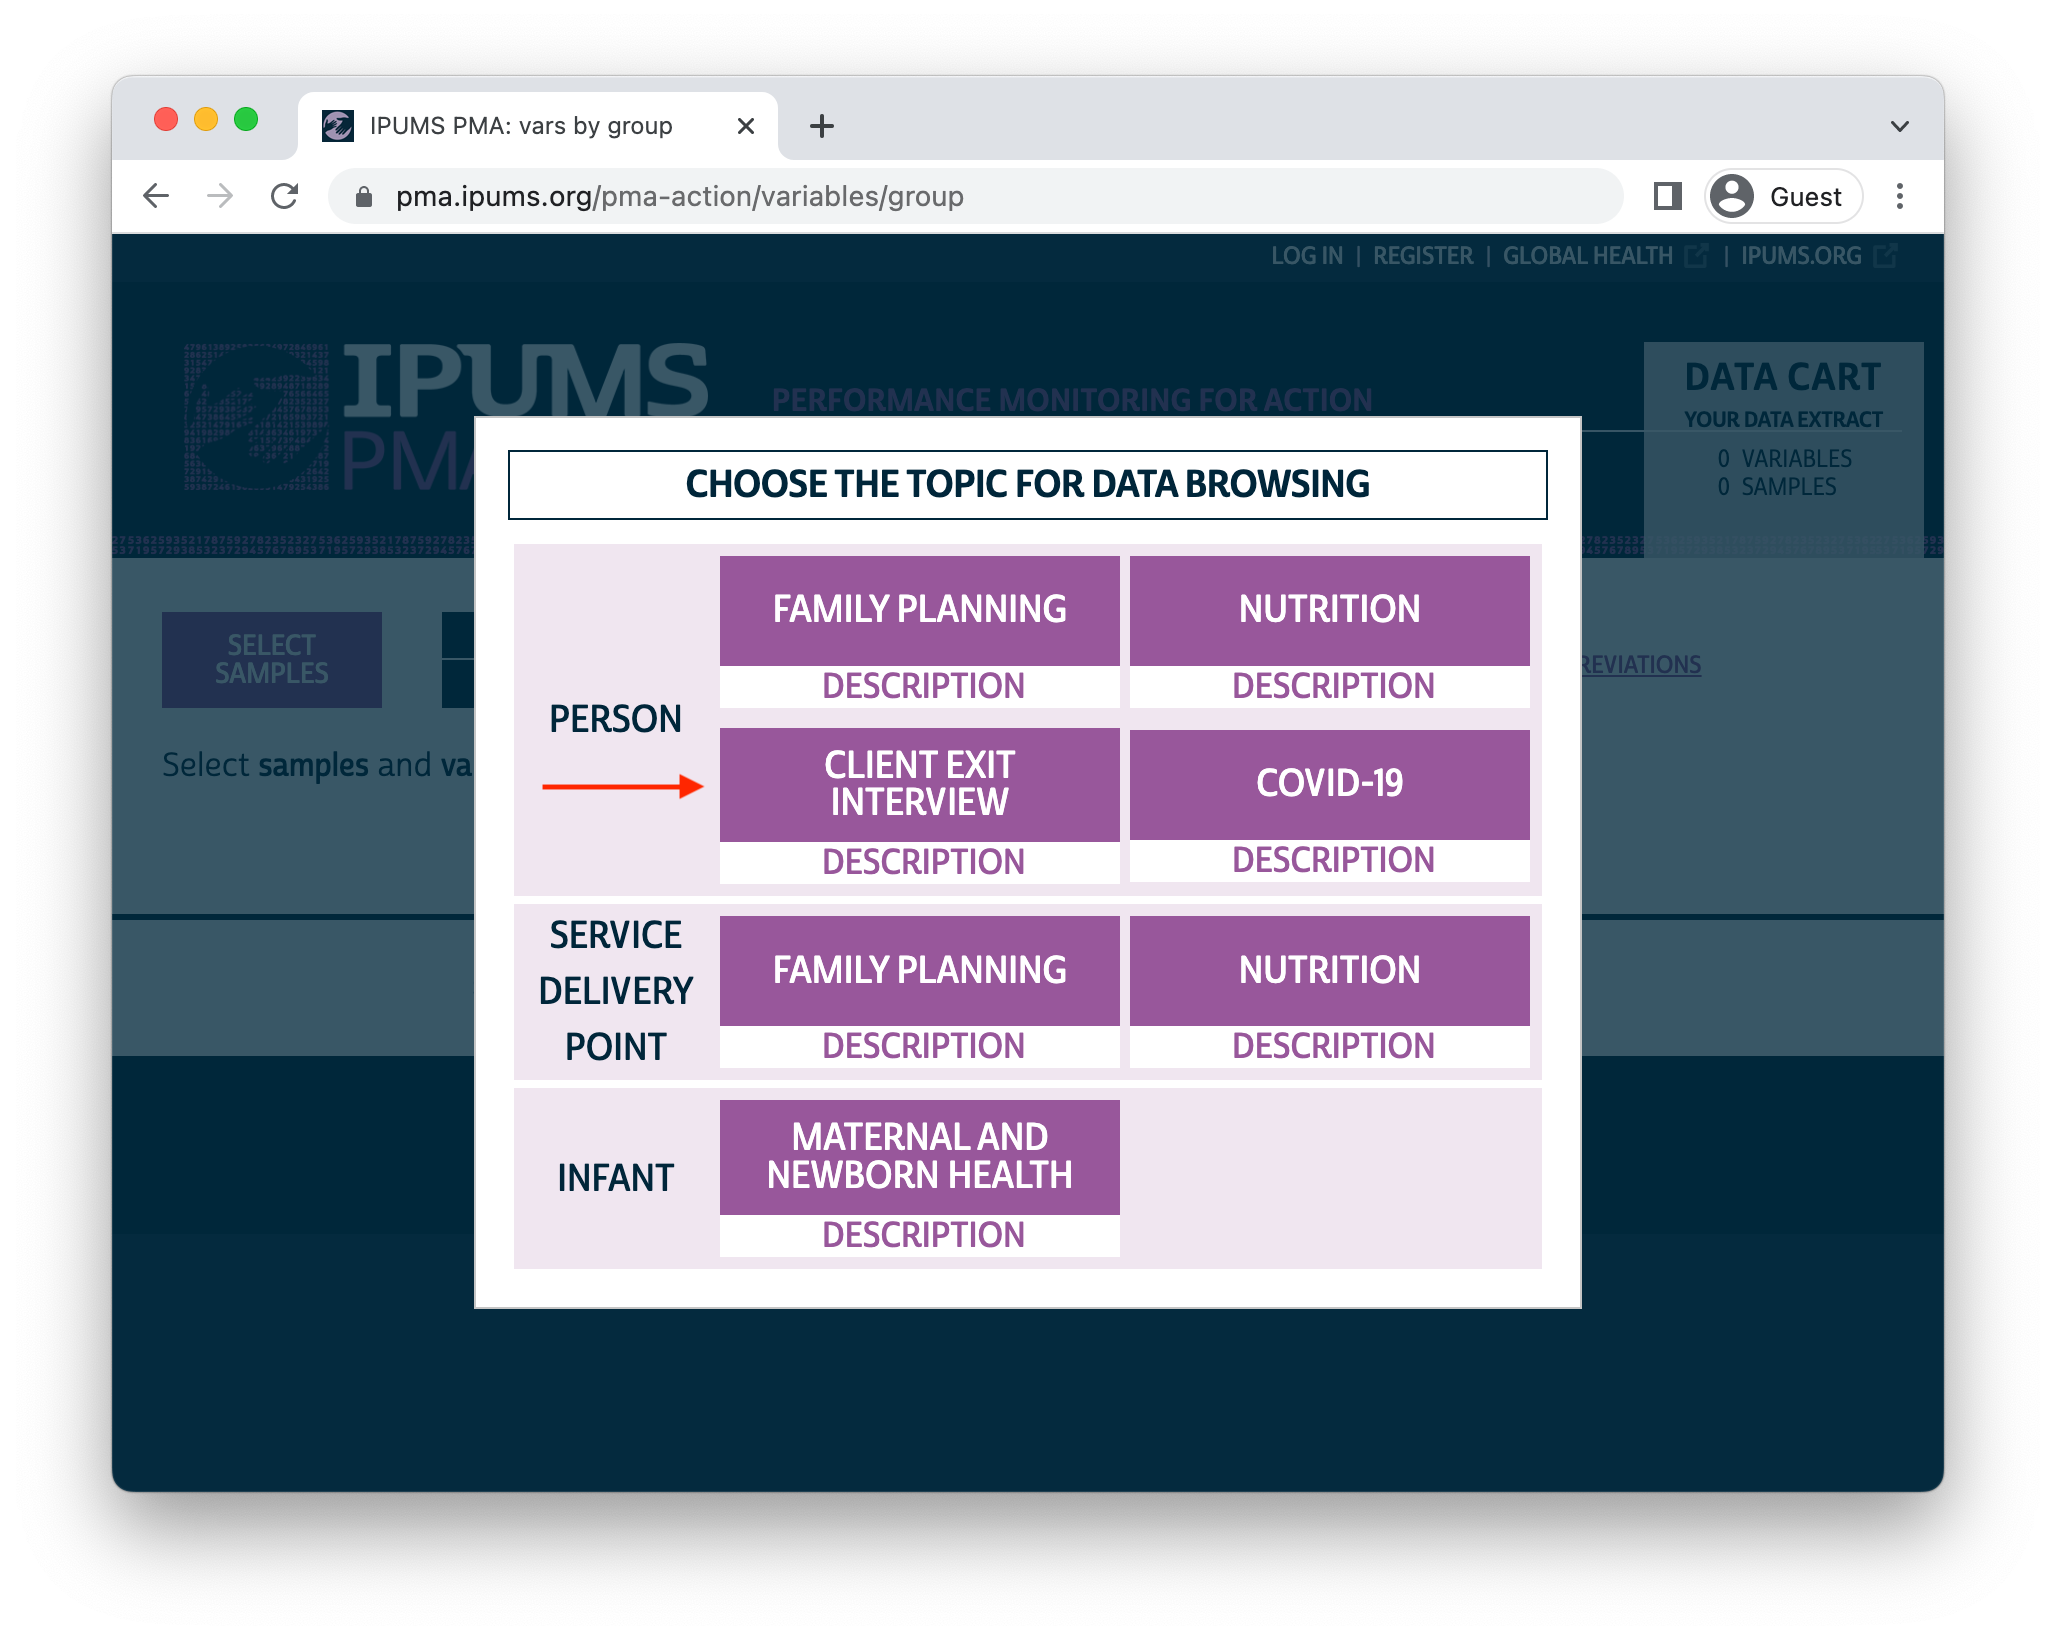
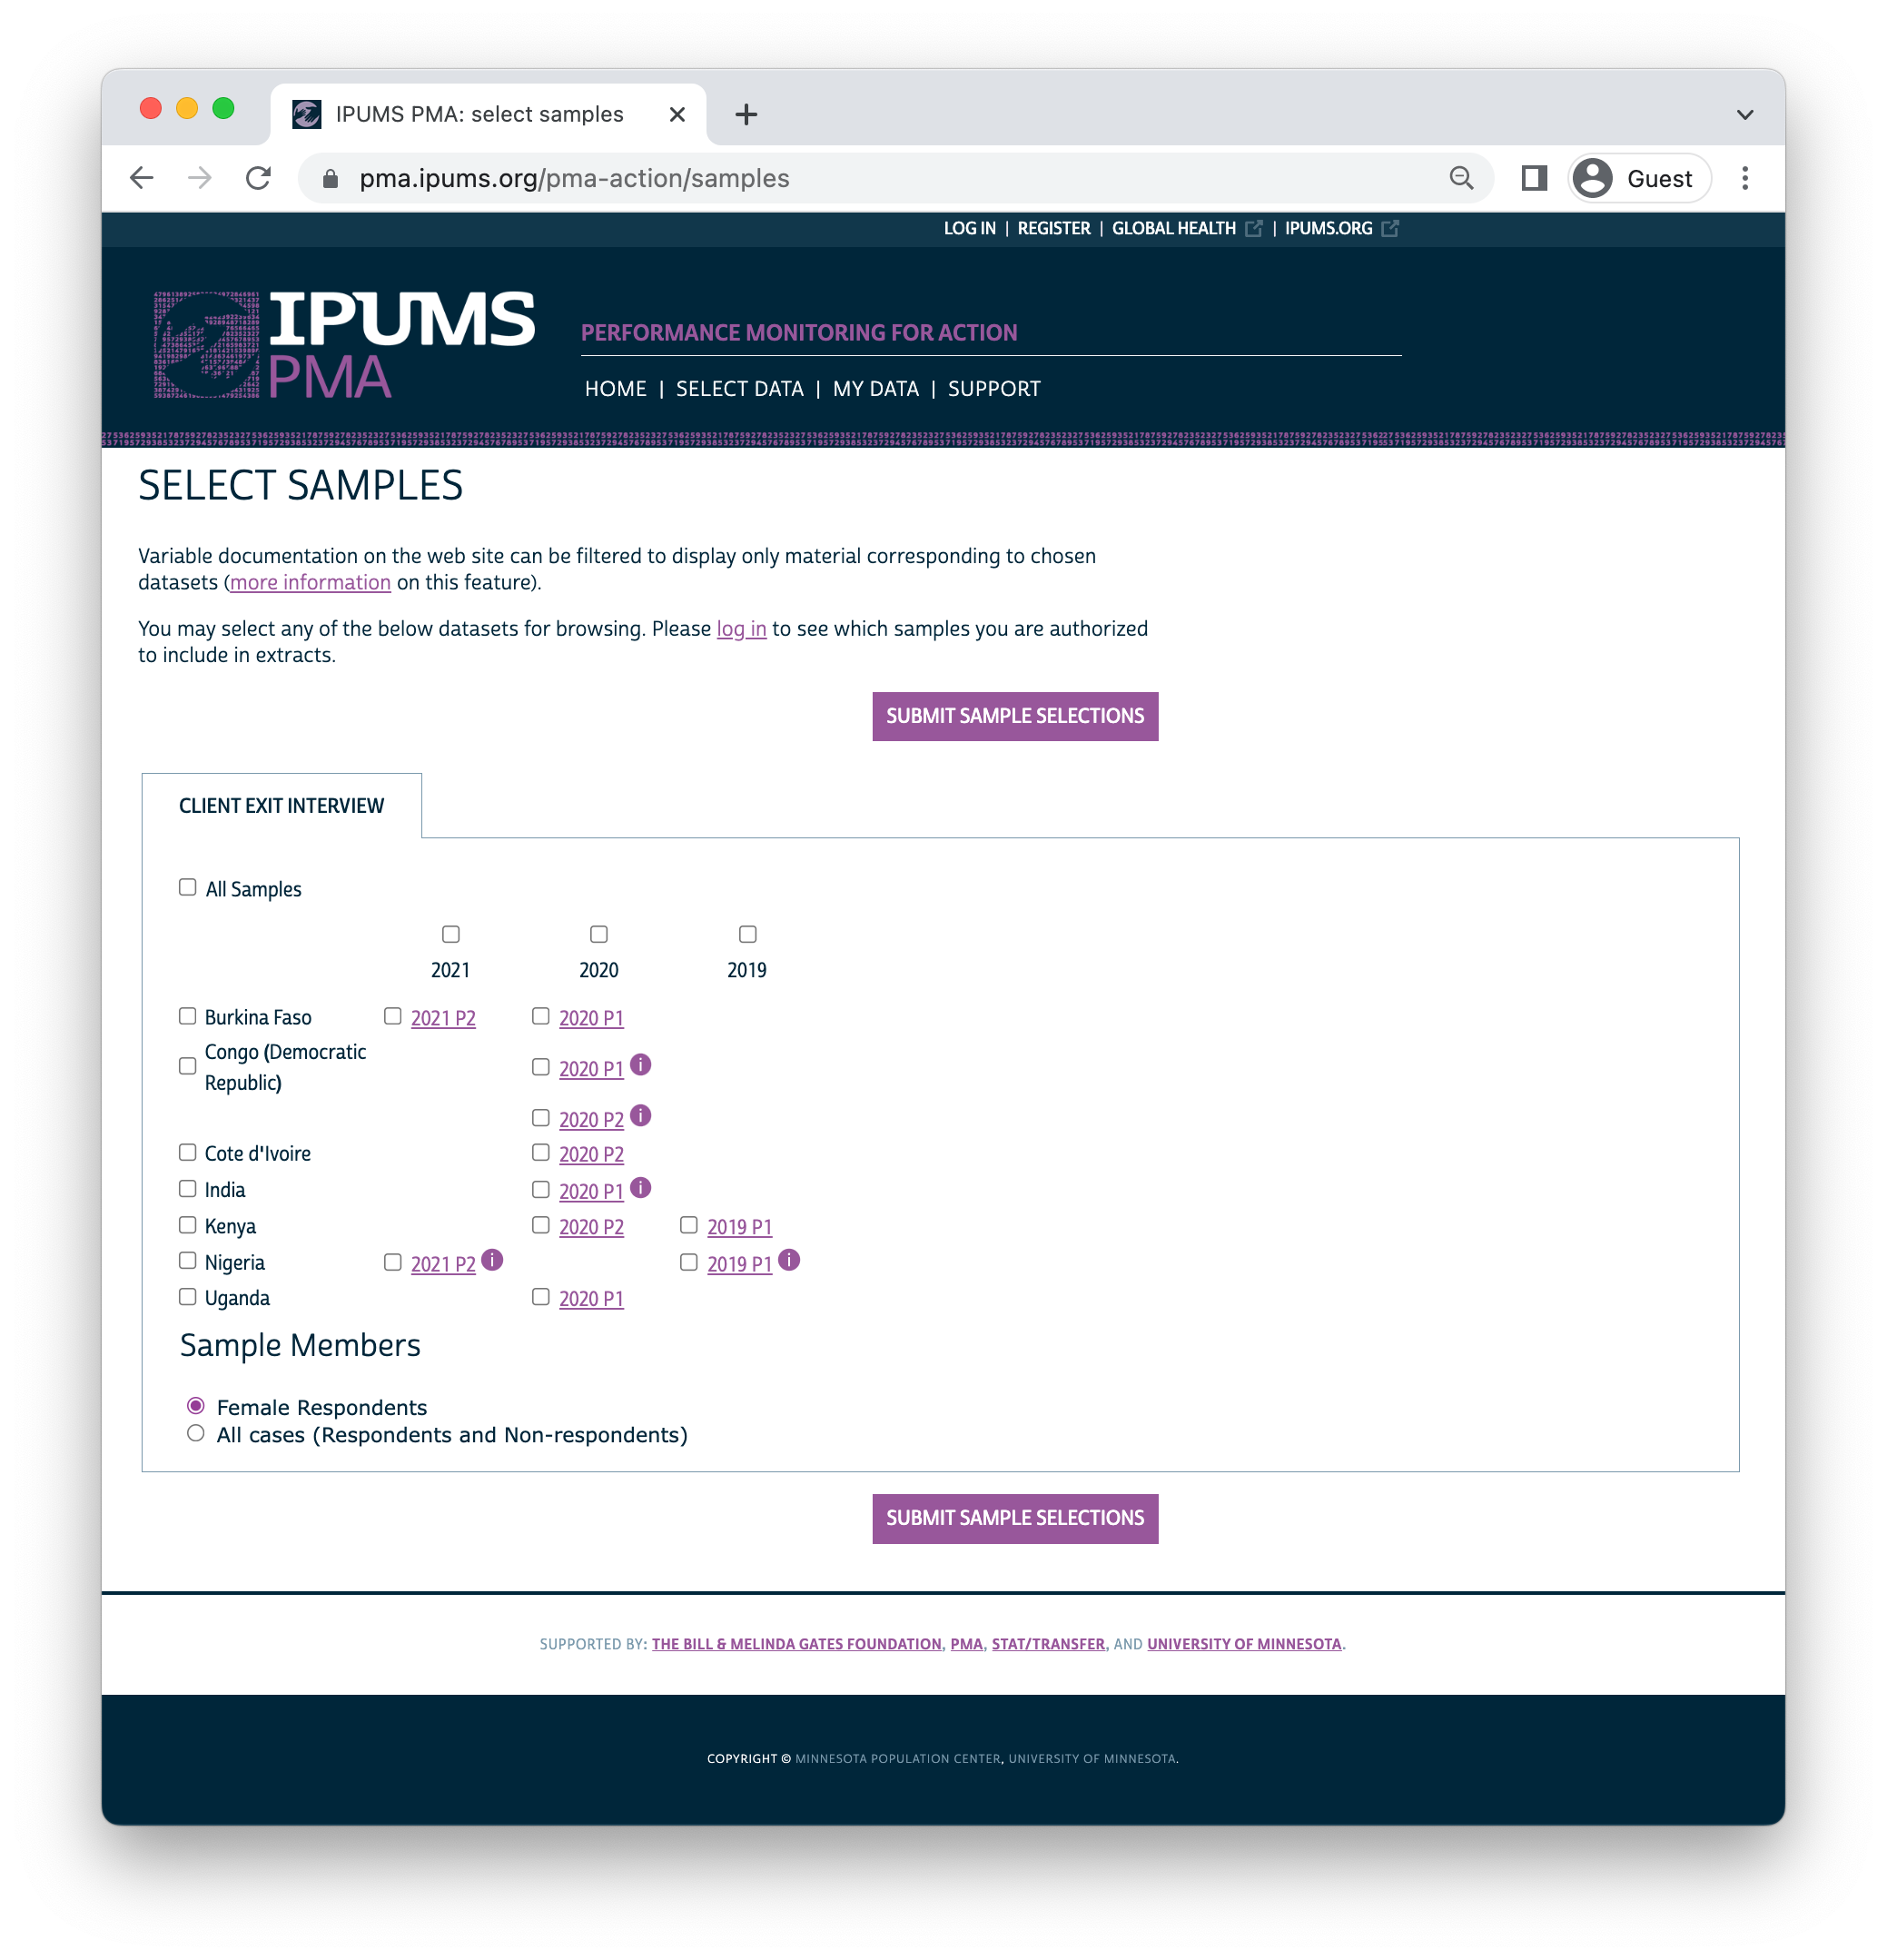
You’ll find CEI data on the IPUMS PMA website if select Client Exit Interview in the unit of analysis menu.
For now, CEI surveys are only available in cross-sectional format. However, we’ll demonstrate how to link them together with longitudinal SDP data in an upcoming post.
As we’ll see in the coming weeks, CEI surveys offer an important way to measure whether and how facilities meet family planning needs for women in the communities they serve. In turn, both surveys help to describe the health service environment experienced by women in FP surveys, including those participating the new PMA panel study we’ve been describing in our most recent series on this blog. We’ll be focusing much more on ways to integrate all three of these surveys together throughout this summer.
Alternatively, you may request an extract containing “All Cases”, which includes records for facilities where SDP respondent declined or was unable to complete all or part of the interview.↩︎