Introduction to Terra Populus
“Terra Populus will integrate the world’s population and environmental data”
That’s the grand promise made by the Terra Populus project, right on the terrapop.org home page. In this introduction I’ll walk through the unique challenge of integrating four heterogeneous data types and how the IT team is building systems to accomplish this and make this promise a reality. Let’s start with a tour of the data types that can be found in TerraPop.
TerraPop Data Types
Let’s begin with population data. The Minnesota Population Center has a large collection of census and survey data from around the globe and from across time. We have over two hundred fifty datasets from more than eighty countries spanning 230 years, and these are just the census datasets - characteristics of individuals and their household. These data are called microdata. Examples of microdata person variables include age, sex, and race, marital status. Examples of microdata household variables include things such as construction material, access to clean water, rent/own designations, and the age of the structure. Very importantly for TerraPop, there are also household geographic variables, which help us determine where on the planet the household is located, with varying degrees of precision.
Next up, we have area-level data, which is another form of population data. Simply put, these are aggregate values (values representing sums, averages, medians, max, min, and so on). The simplest area-level variable may be “total population”, but generally there is more than one dimension and area-level data is usually organized into tables. For example, “Age-by-Sex” is a two-dimensional table of area-level variables, and “25-year-old males” is one area-level variable within the table. The same table would also have variables like “25-year-old females”, “32-year-old males”, and so on. Other table examples would be Race-by-Educational-Attainment or Median-Household-Income-by-Marital-Status. There’s an “area” associated with each table since these variables are describing a particular geographic place, usually defined by a political boundary, such as a nation, state, or county. So there might be an Age-by-Sex table for the “United States” and an Age-by-Sex table for ““Sao Paulo, Brazil”, and the “25-year-old male” variable within each would have a different value, of course.
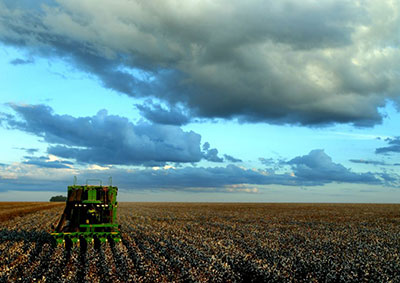
So, microdata and area-level data both describe populations. What about the environmental part of the mission? For that we turn to sensor-based data usually in the form of georeference rasters (GeoTiffs). These include data such as land use (“agricultural”, “dwellings”) and land cover (“forest”, “water”) classifications, information about various crops, as well as data like temperature and precipitation. Raster data are essentially just bitmaps - the surface of the Earth is divided into cells and each cell has a value for that variable for the part of the Earth represented by that cell. (Because of map projections, the cells don’t all represent the same amount of Earth area, but that’s a blog post for another day.)
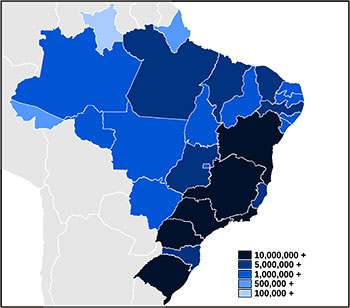 Population by State in Brazil
Finally, we need a way to represent the areas to which area-level variables are bound - for that we have shape files. Shape files are just collections of polygons which represent boundaries (i.e. - maps). We have map data for most countries found in the MPC’s microdata collection, as well as several other countries (since we have raster data that spans the Earth, we want to include boundaries for places even if we don’t have any microdata about their populations.)
From Data Processing to User Extracts
So, in sum, four very heterogeneous flavors of data come together in TerraPop through the use of ruby (it’s actually jruby), java, javascript, Closure/SOY and PostgreSQL/PostGIS by a dedicated cohort of research staff, IT staff and student research assistants. Together, we are able to blend all of those ingredients into a secret sauce that is TerraPop.
From an IT point of view, for TerraPop we have to build three collections of things: tools to help us prepare the data and metadata (our data production and import workflows), tools to help our users find and select the data and metadata they want (our web-based data dissemination UI), and tools to create and deliver users’ extracts of data and metadata (our extract engine). Although we’ve followed this high-level pattern on prior MPC projects like IPUMS and NHGIS, TerraPop introduces new challenges to all three phases due to the scale and heterogeneity of the data involved.
For the data production process, we build tools to help track incoming datasets, manage the metadata about those datasets (plus the additional metadata we create as we go), and do a significant amount of data ingest and pre-processing. We ingest huge amounts of microdata and area-level data from the MPC’s IPUMS and NHGIS projects, respectively. Java plays a role here since we need good I/O performance. We also do some parallel computation to produce additional, new area-level data from the IPUMS microdata. Finally, we have a set of spatial tools and workflows we use to prep shapefiles and rasters for use within the system.
Moving on to the web UI, it has a base layer of Ruby on Rails with a top layer of JavaScript. Our primary JavaScript library is jQuery with a pinch of underscore.js. The UI experience relies heavily on AJAX. Ruby on Rails and ActiveRecord allow for data models that can easily bend and adapt to additional datasets that might not have been initially considered at project conception; using AJAX, passing around JSON objects and having jQuery and Closure/SOY do some of HTML rendering client-side allows for a more flexible UI.
Once a user has selected data for extract, there is a fair amount of magic to deal with the four different data flavors in the project. Microdata live in sometimes-enormous fixed-width flat files while area-level data live in PostgreSQL, and our rasters and shape files live in a PostGIS layer atop PostgreSQL. To integrate all that data we have to be able to convert from one type to another in a number of different directions. It’s best explained with a whiteboard and a fair amount of caffeine, but an example walkthrough will give you the general flavor of it.
Example Use Case
 For our walkthrough, let’s say our user wants to obtain the microdata records from the Brazil 2000 census, but to those records she wants to attach the population of the state the person lives in and the corn yield of the state the person lives in. (Maybe she’s trying to figure out whether population density or corn farming productivity has a stronger effect on the economic welfare of Brazilians? We’re IT experts, not economists - this may not be the most realistic example :-)
To produce this data set, we will ultimately have to attach area-level data (total population) and raster data (corn yield) to microdata (the good people in the Brazil 2000 census). The common thread that allows us to do this is geography. The person is in a household which has variables that tell us which political entities they are within. The area-level variables are associated with a political entity as well. And the rasters - well they typically give us latitude/longitude data, so it takes a bit more work, but it’s still a geolocator so we’re ok - we have geography information for all required data.
The area-level-to-microdata part’s not too bad. Starting with the person record, we can obtain the household record, look up the state the household is within, then consult the database for the area-level variable which tells us the population of that state, and attach that value back to the person record. So far, so good.
Where it gets trickier is with the corn yield data. Remember that corn yield data is in a raster. To attach this to the person record, we first need to figure out what the corn yield is for the person’s state, since that’s our user’s desired geography summary level. But the corn data is summarized by cells, not by states. Thus, we have to go through a process of overylaying the raster data onto the state’s boundary (which comes from a shape file - so now we’ve used all four data types for this extract).
To start, we have to figure out which of those raster cells are within the state’s boundary and which are outside (and the extra fun case of raster cells which intersect the state’s boundary - but that’s also a blog post for another day). Once we know which raster values are relevant, we can apply an aggregate function. It’s probably an average in this case, but maybe our intrepid researcher would prefer median, or max, or some other aggregate function - they choose as part of the request process. This allows us to compute a value that represents corn yield for this person’s state. Finally, we can attach that value to the person record.
Computationally, it’s not so hard for our extract engine to do this for one person in one state. But in this case, we’re doing it for every person in the Brazilian 2000 census. And TerraPop’s goal is to allow a researcher to do comparisons through time and geography, so we might have to do this for every person from a dozen countries around the world - at multiple points in time for each country! All for a single user’s extract request. All while other users are also requesting similar things.
To pull this off, performance is obviously a top priority. We lean again on Java for efficiency at the critical parts of the process. We are also exploiting parallelism wherever possible to allow us to scale up as demand for the project’s data increases. We are continually testing technologies such as Hadoop-based platforms and NoSQL database engines to find novel platforms that might scale better. We’re actively developing new approaches for doing spatial computations at this scale. It’s tricky, challenging, fun - but it’s certainly not boring!
That’s a quick taste of the TerraPop project. If this sounds interesting or there are certain aspects of the project you’d like to hear more about, let us know in the comments. We’d love you hear from you!
Authored by Alex Jokela
Data