Exploring Nicollet Island
[Note: This post represents work done by the MPC IT Shark Tank 537 team, consisting of Jake Wellington, Colin Davis and Jesse Erdmann.]
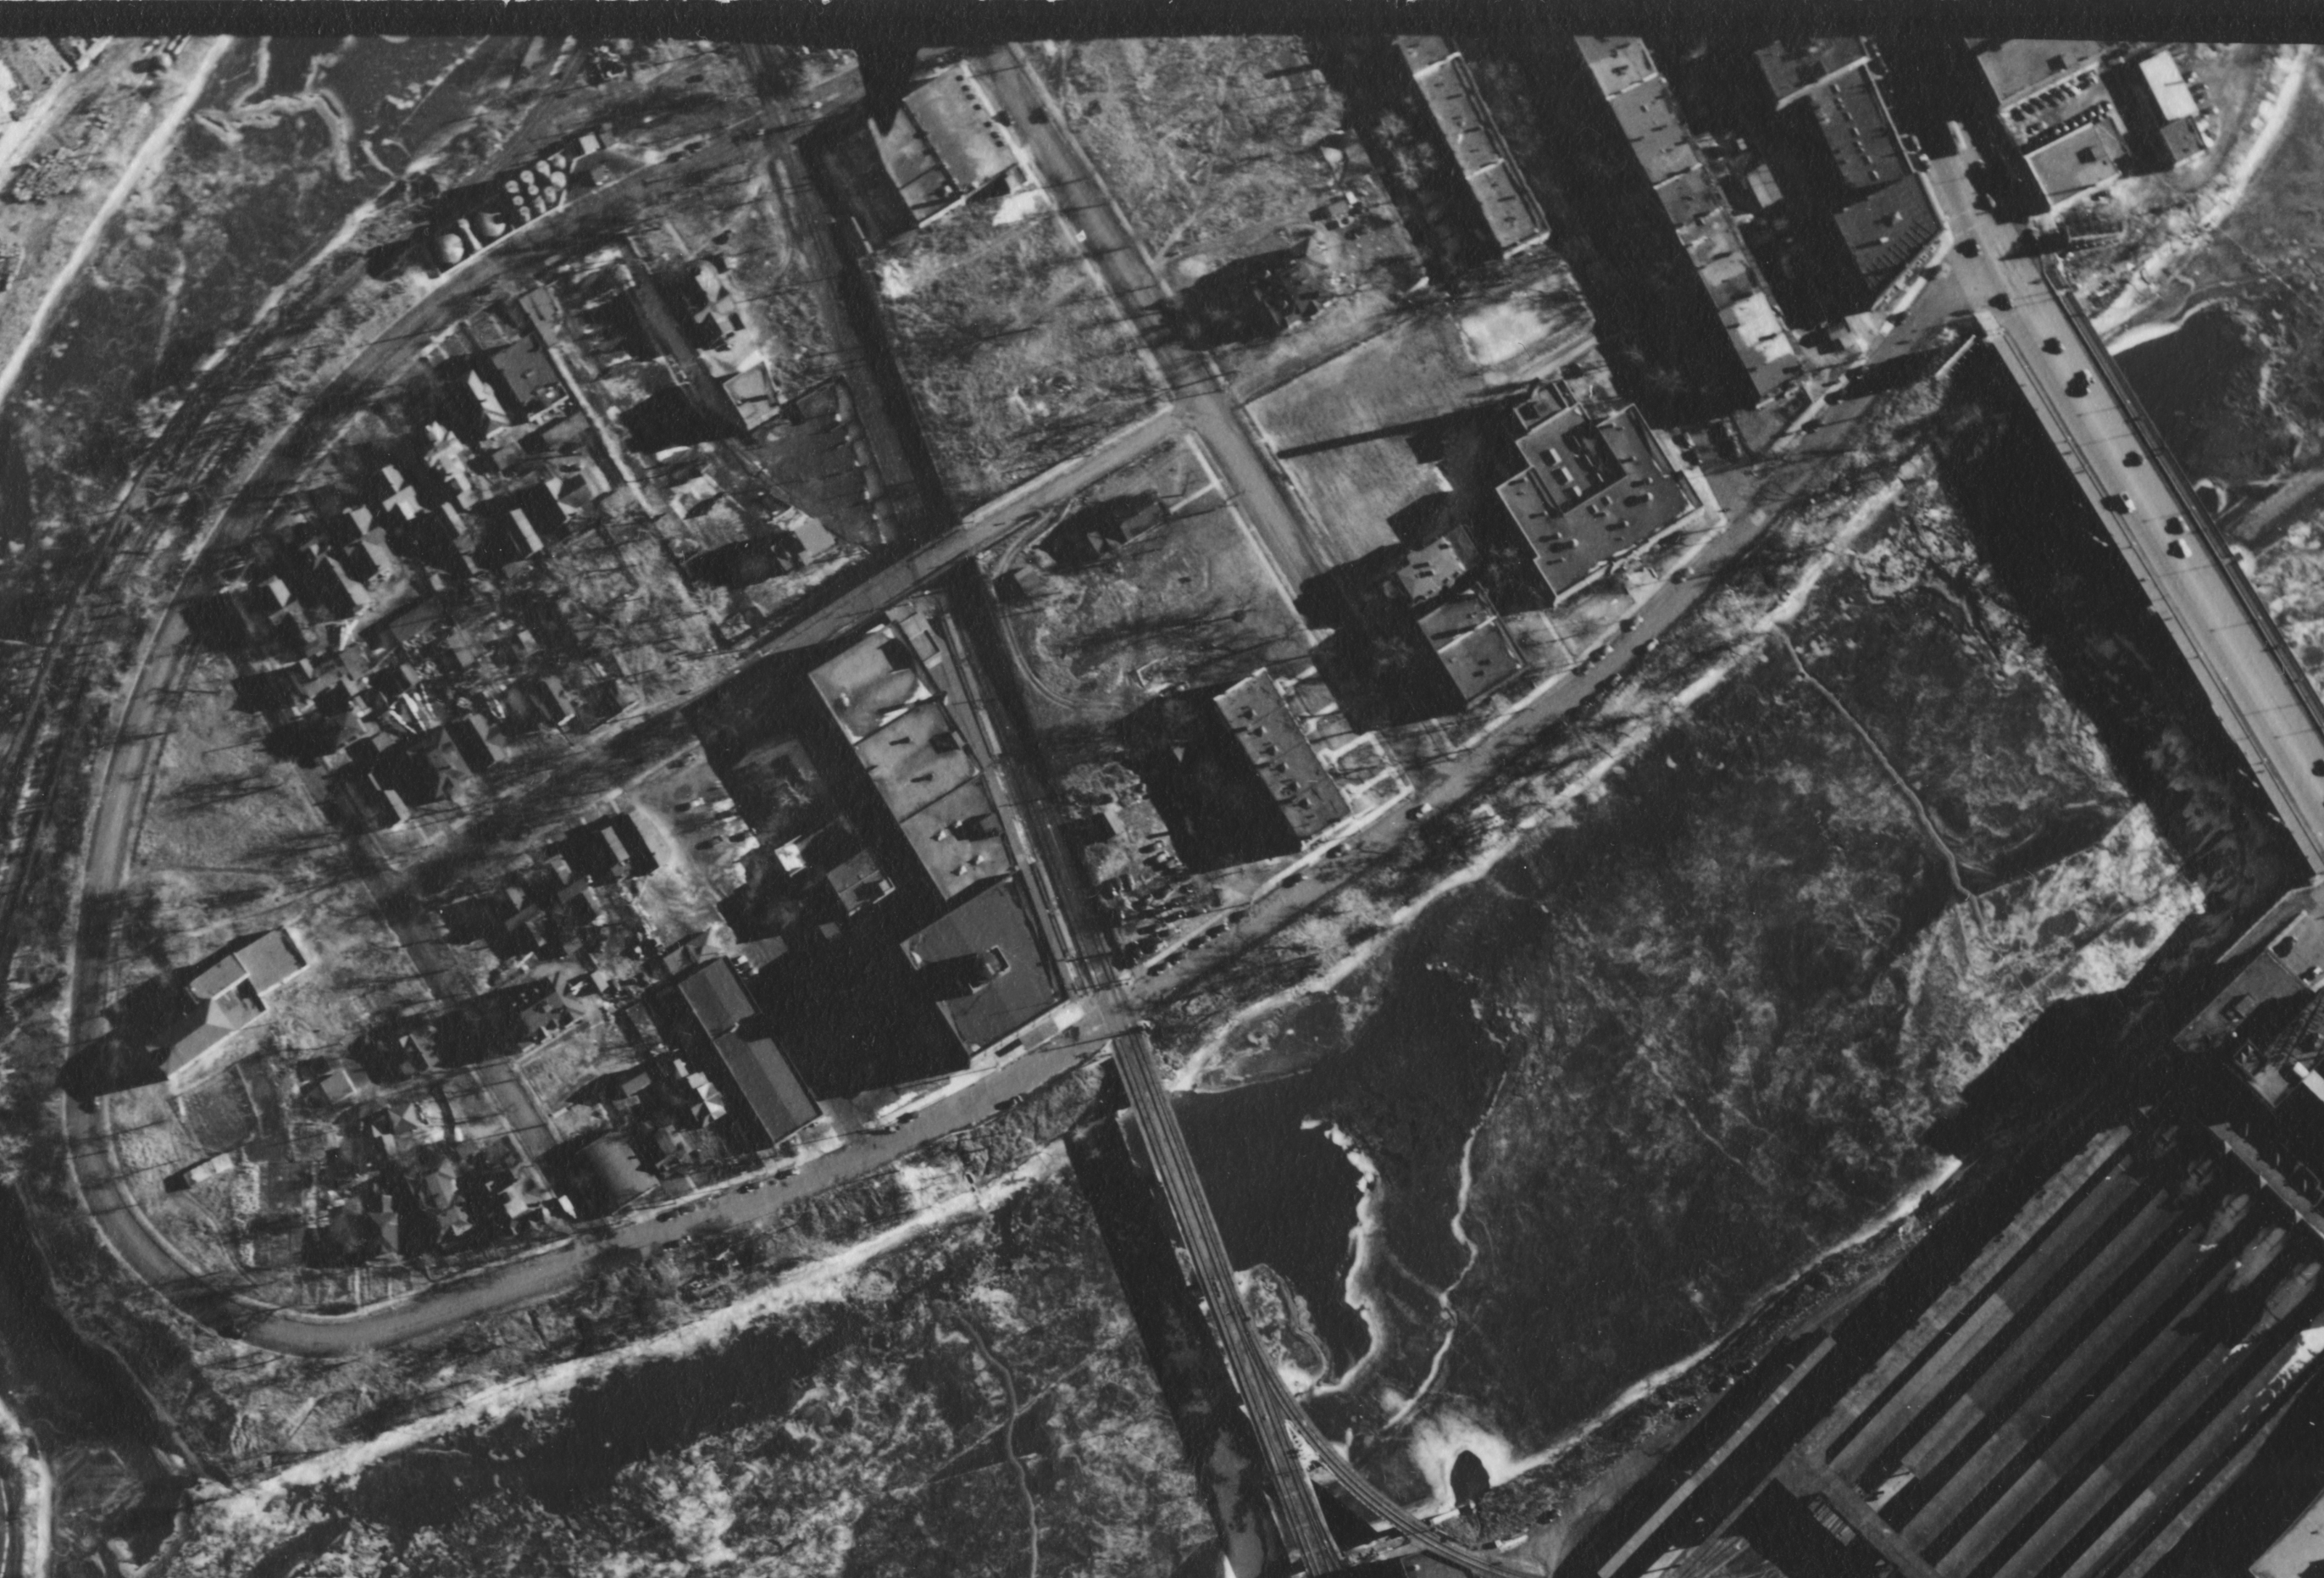 (Aerial Photograph of Nicollet Island in 1940 – John R. Borchert Map Library)
So, you want to research the history of your neighborhood. Where do you start? You might study newspaper archives, talk to a historical society if one exists in your area, and visit the library after exhausting leads from a Google search. For a narrative account of a place you may get lucky and find articles. But what about more quantitative information answering questions such as “How many people lived here over the years?” and “What kind of people were they?” You may run across sites that claim to have data from the U.S. Census and you think “Perfect, I’ll just look up my neighborhood…” And that’s where you’ll often run out of ideas, because – unless you’re very lucky – no data exists covering only your neighborhood. Either the area is too small or tract boundaries cross right in the middle of your area of interest. This is especially true if you’re looking back to the 1940, 1930 or earlier census years, where tracts were fewer. In more recent years the Census Bureau published statistics on city blocks and groups of blocks (though the kinds of information at that scale are limited), but you’ll find no such stats in earlier decades.
In this post we’ll show you the data behind the statistics the Census Bureau publishes and talk about how you can create never-before-published statistics for your neighborhood. We’ll use Nicollet Island in Minneapolis, Minnesota as our case study. We’ll look at data from between the years 1900 and 1940.
The Wikipedia article on Nicollet Island has a good account of the history, but you’ll notice it doesn’t give any details about the population living there over the decades, other than a general story.
Before dismissing the possibility of finding useful published data and maps, we can check out NHGIS (the National Historical Geographic Information System) from our own Minnesota Population Center. You might also check out Social Explorer and American Fact Finder.
For Nicollet Island, we started by browsing NHGIS data to see what we could find for 1940 and earlier. We found summary statistics for the area of Minneapolis containing Nicollet Island, but the smallest geographic region available covers too much area – and therefore lots of people – that aren’t relevant. Here you can see a map of Nicollet Island and the surrounding area, color coded by the dividing lines of the census tracts (there’s also a dividing line in the water on the west side of the island):
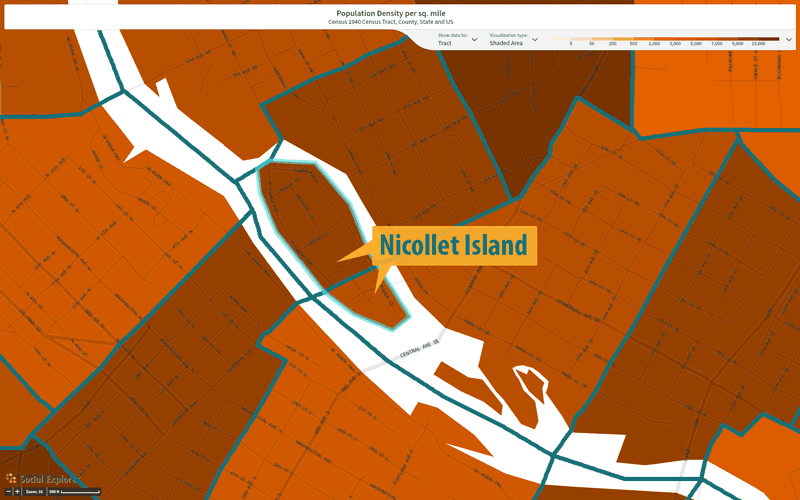 Census Tracts for 1940, from socialexplorer.com using NHGIS boundary files
Microdata to the Rescue?
All the statistics published by the Census Bureau and found online came from somewhere. People fill out the census forms with individual responses which get collected and added up, right? So in principle if we could find that information for past decades we could pick out the people living on Nicollet Island and create our own stats. It turns out the U.S. Census makes these records public after seventy-two years have passed, meaning we could have access to the records before 1950.
You can find scanned images with some helpful search capabilities at ancestry.com among other places. The service is designed for small scale research, namely geneology research. Looking up each form, noting down responses to questions by hand, and searching address ranges would take a too much time for demographic research.
Fortunately demographic researchers have made the public Census forms machine readable. In the past they have sampled the forms and entered one or five percent of the data, allowing for many tabulations of the data that provide useful information not previously published by the Census. But Nicollet Island has numbered in the hundreds of residents, so one or five percent samples of them would not tell you much with any accuracy.
Lucky for us, MPC has made all the census data machine readable. It requires a lot of additional processing to make it acceptable for research, especially if that research spans decades. Currently we have only published the 1940 and 1880 full count data, but eventually all decades from 1850 will get published as we “integrate” it. In the meantime we can offer a peek at what could be done with this data.
Matching these records on their street addresses we collected households of people living on Nicollet Island. Then we aggregated the data to these custom summary statistics:
You can also use the microdata to create narratives for individual households of people within your target geographical area. Combining these narratives with historical photography can help create a more complete picture of life in the early 1900s. Below are some photographs of the island taken in the late 19th century and early 20th century, and then an interactive map with data from individual households attached to their modern day locations. The map showcases data for 1940, 1930 and 1920.
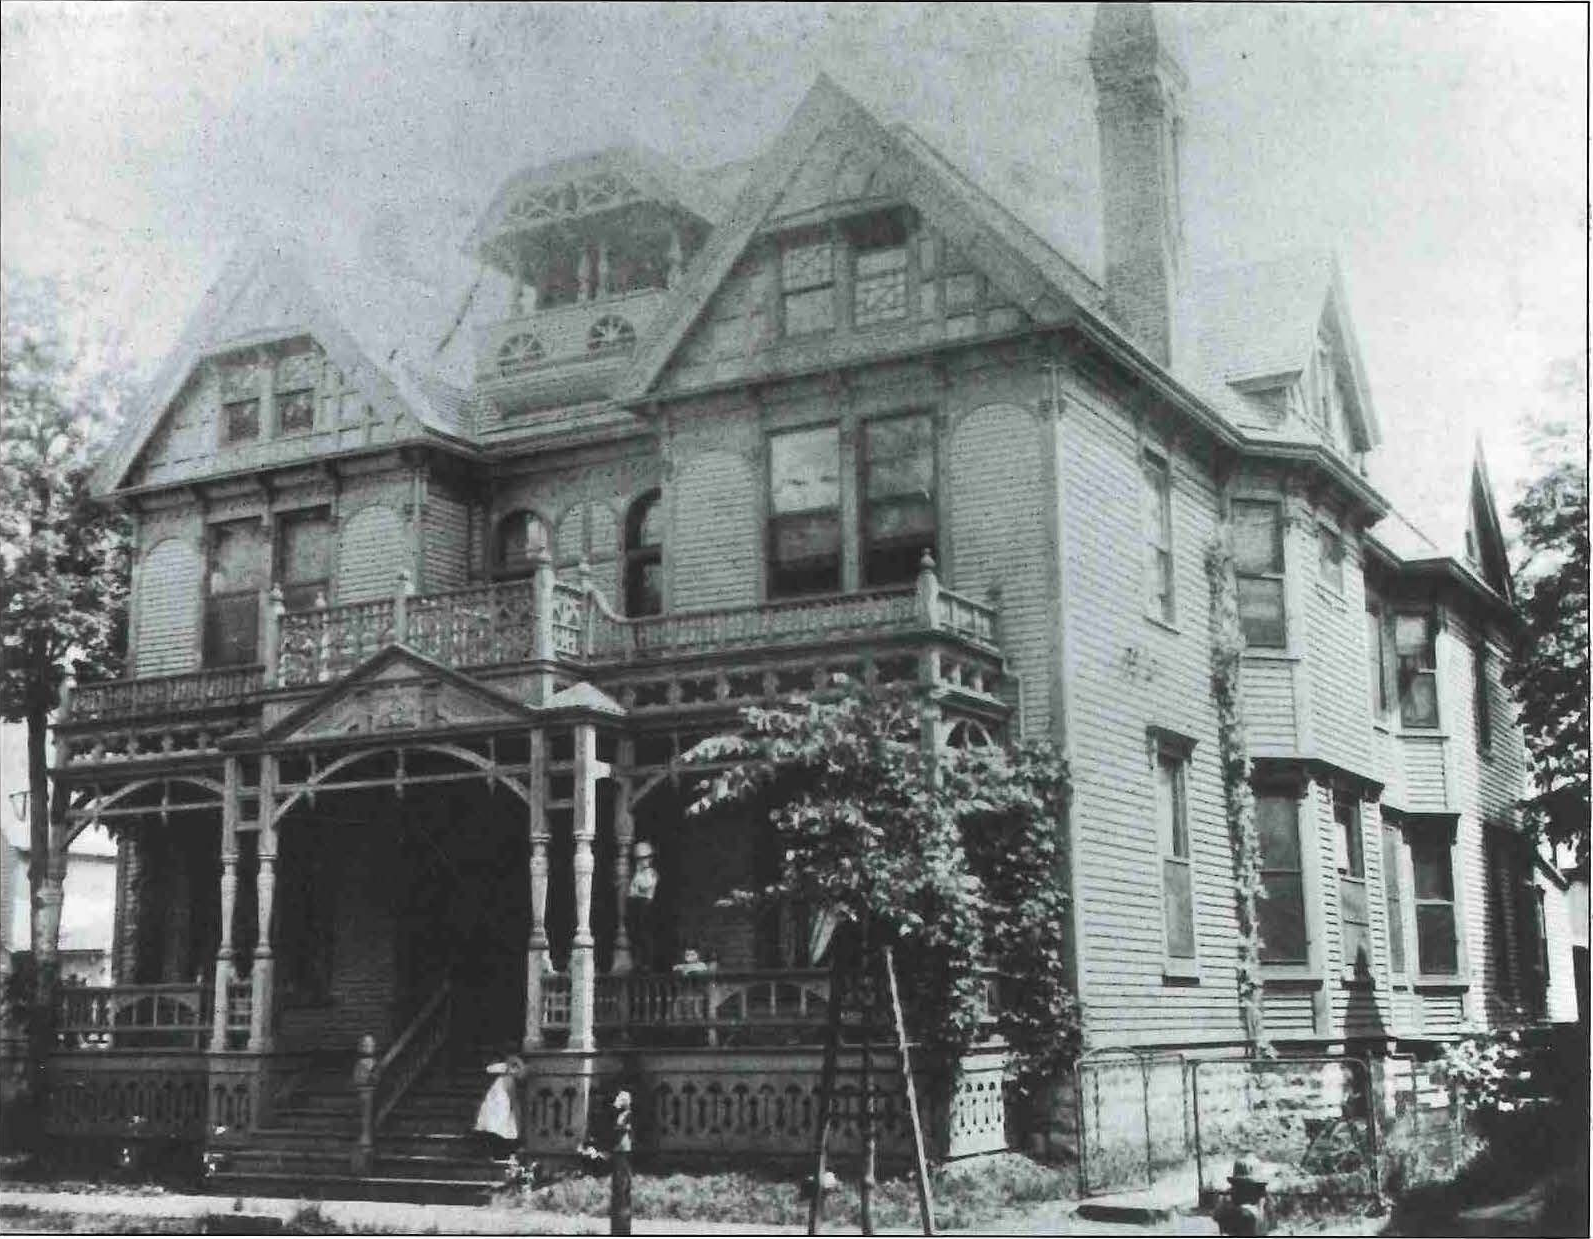
A few houses: 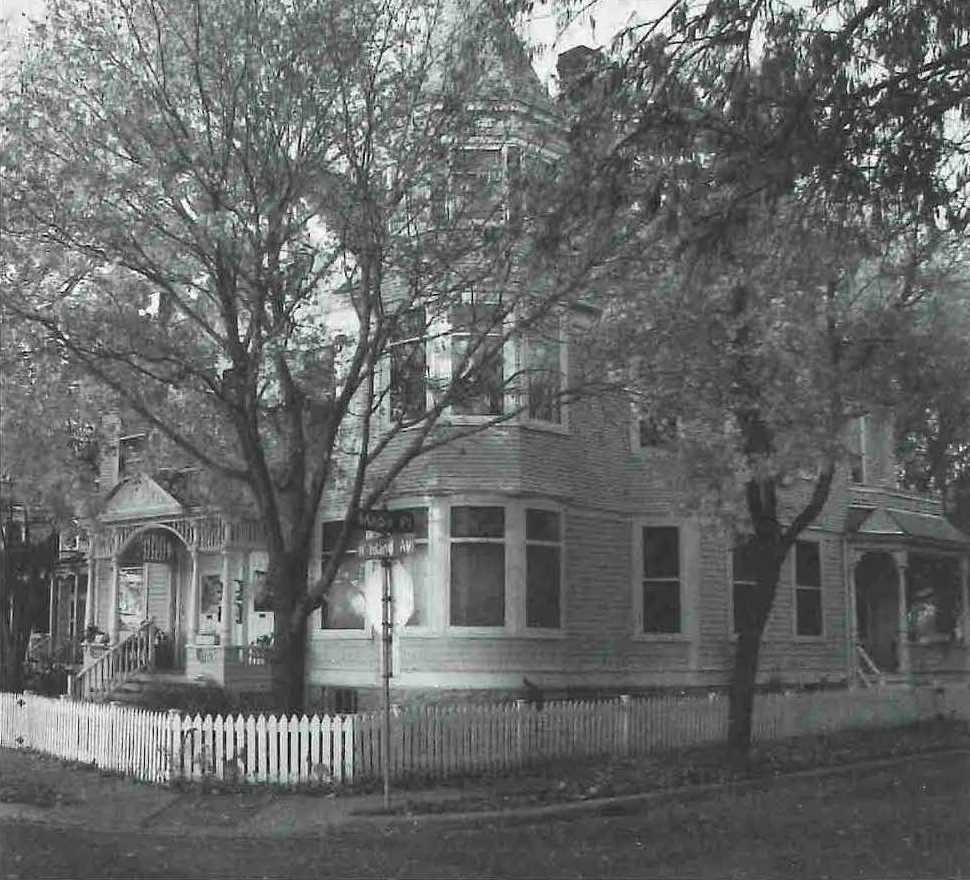 (107-109 West Island Ave, Courtesy of John Chaffee)
 (15-17 Maple Place, Courtesy of Christopher and Rushika Hage)
A local grocery store: 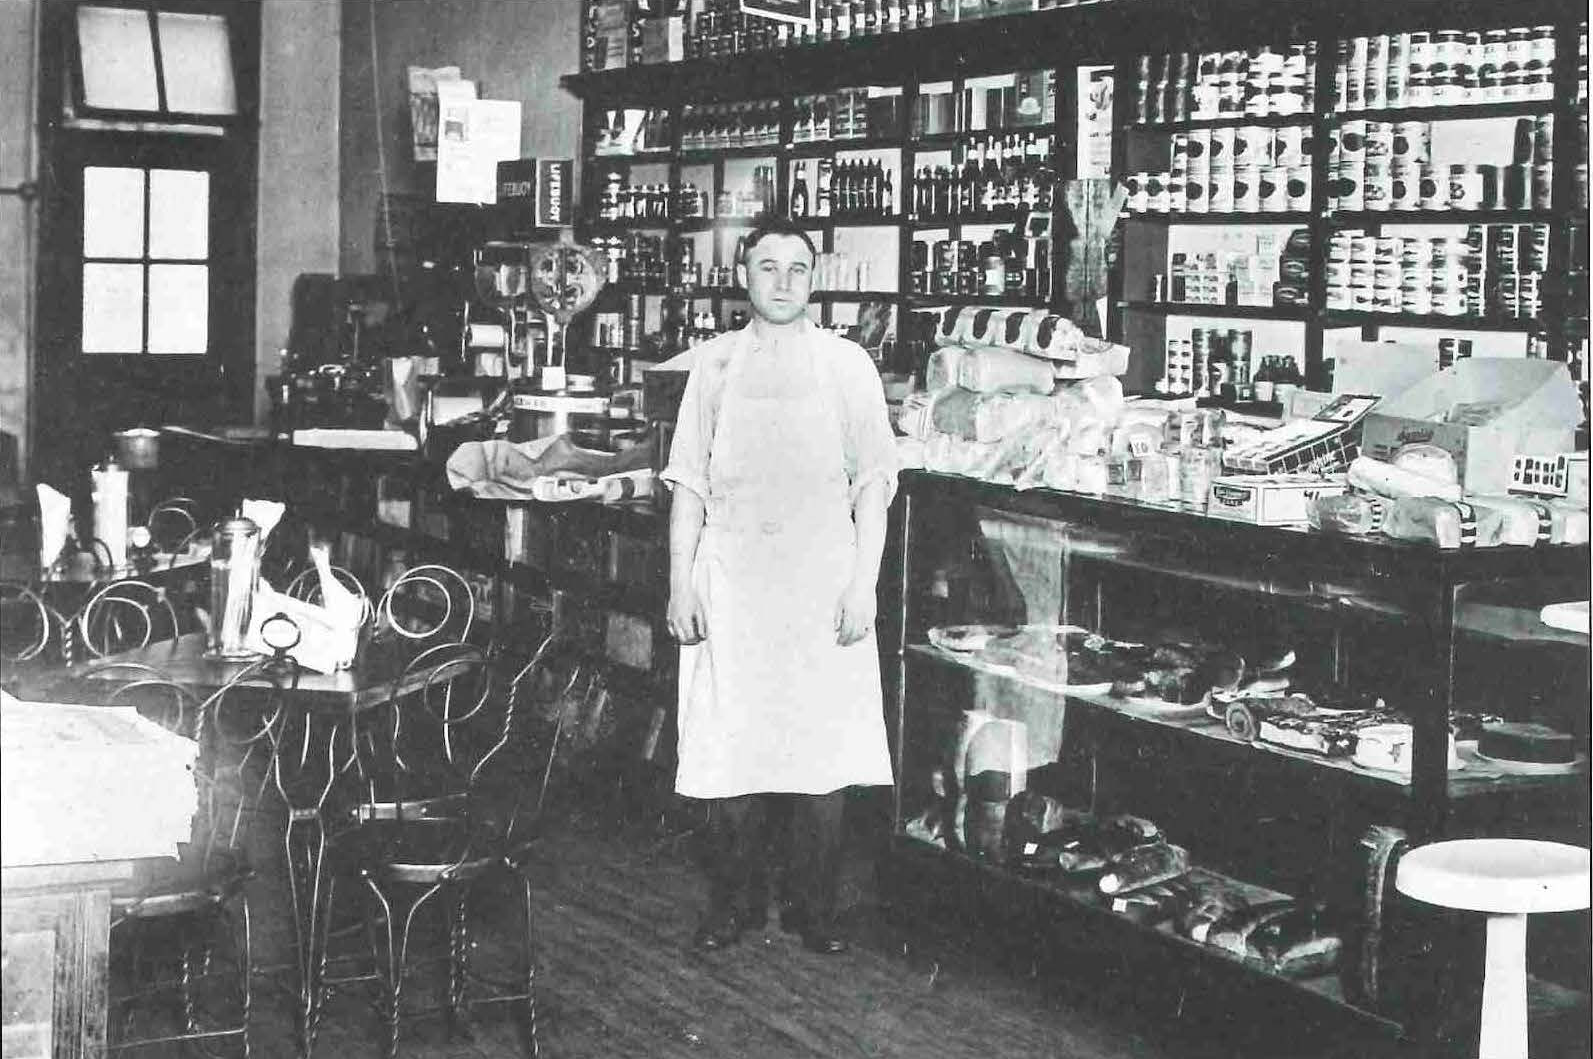 (Morris Island Grocery, Courtesy of Harry Lerner)
Apartments on Grove Street: 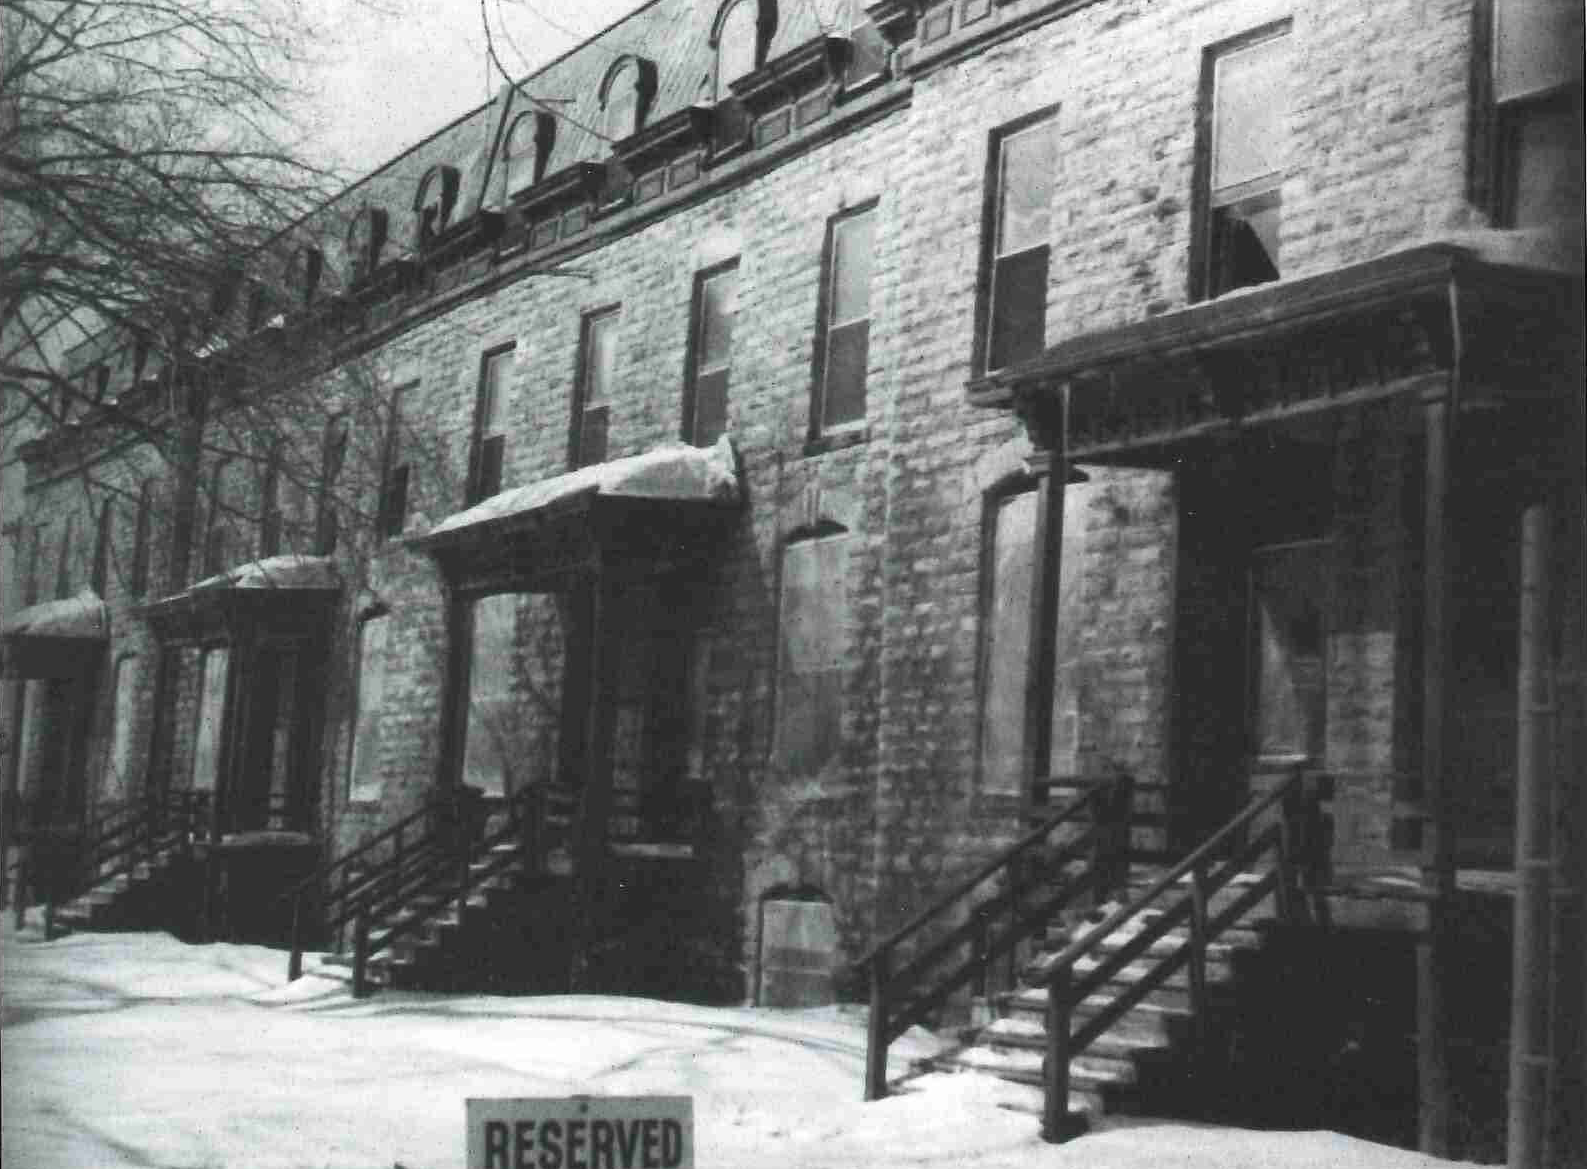 (Grove Street Flats, Courtesy of John Chaffee)
And the interactive map:
Making Custom Geographies
This post is really just a specific case of defining a custom geographic area and building a dataset containing records of people living in that area. To do the same thing for other places you will have to put in the work to manually look over the census records and match street addresses against maps. If the streets have changed names or locations you’ll need maps from the time period you’re studying.
An ideal research tool would allow a user to draw an arbitrary boundary on a map and recieve all records for people living in that area at a given time. For that to be possible, all the microdata would need fairly precise latitude and longitude values. At the time of this post, the MPC is soon to receive geo-coding (called geo-points) for microdata on the full count 1880 data. Work is currently in progress to create geo-point data for the 1940 full count data as well. Once you have access to these geo-point data on our microdata, making your own custom geographies will be easy. This geo-point data will open up many new possibilities for using census microdata at the neighborhood level, among other possibilities.
Authored by MPC IT
Data