Vegetation and Land Cover Part 3: Land Cover/Land Use
An almost overwhelming number of vegetative and land cover data types exist. This post describes and compares sources of land cover data, as the final installment of a series of three.
Land cover
Land Use Change Dynamics
Agriculture
terra
sf
Author
Affiliation
Devon Kristiansen
IPUMS Global Health Research Manager
Published
March 13, 2026
This post is our third in a series discussing and comparing spatial land cover data. The previous two posts have covered vegetative indices and environmental moisture data. Now we will describe land cover/land use data and where to find it.
Land Cover
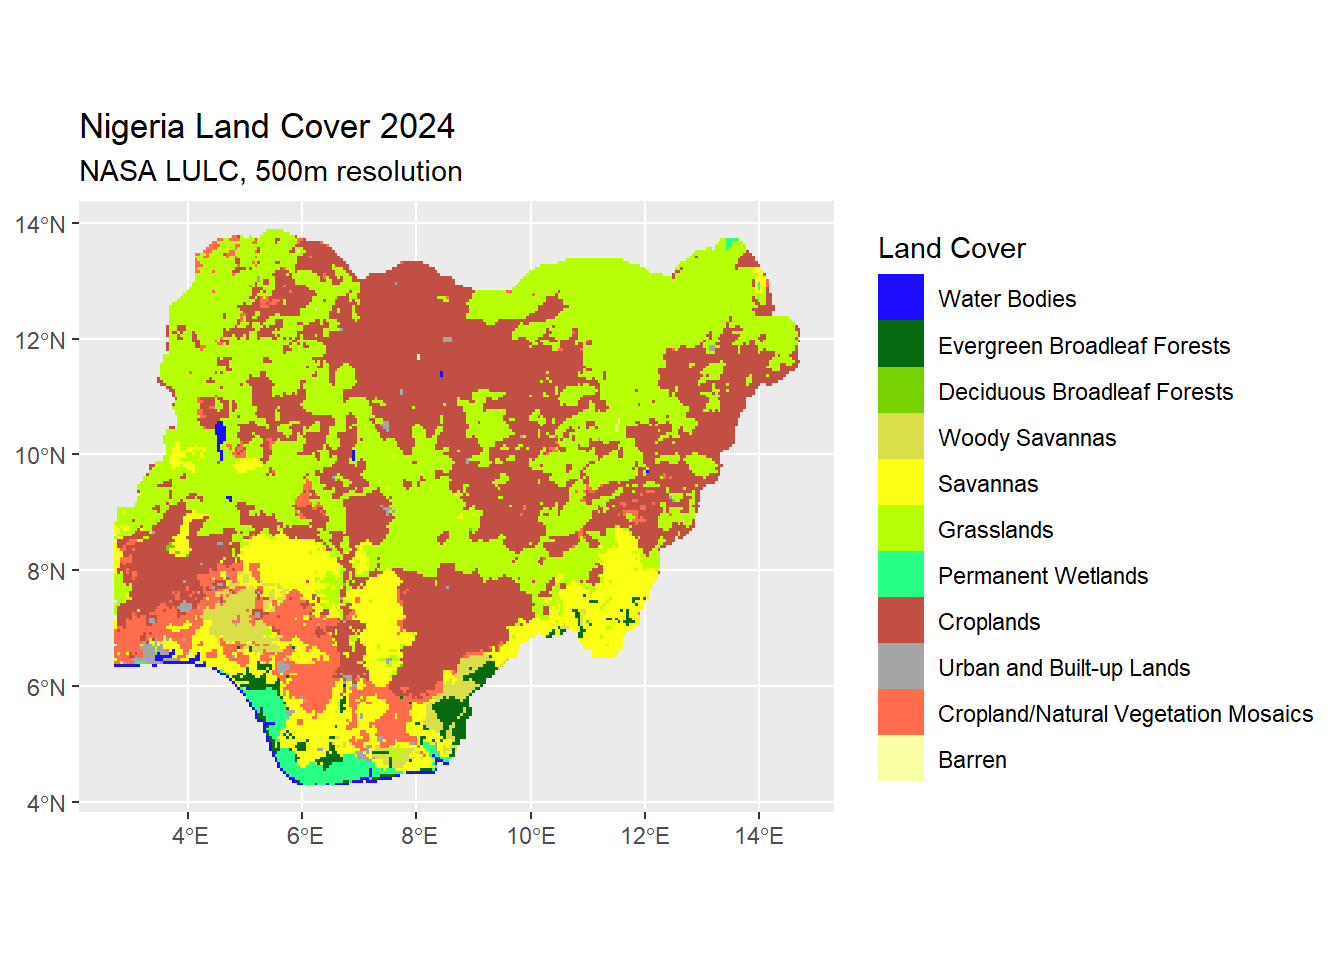
Obviously, vegetative cover is not the only type of surface on Earth. Datasets such as Land Use/Land Cover from NASA (LULC) and Global Dynamic Land Cover from the Copernicus Programme describe the human lived environment using classification schemes that describe land in terms of impervious surfaces (urban or built up) or by ecosystem type (wetland, evergreen forest, savannah, permanent ice cover, etc). Below is a map using the LULC data for Nigeria in 2024. Click “Code” below to see the R code that created this map.
Code
#Read in necessary librarieslibrary(terra)library(dplyr)library(tidyr)library(stringr)library(sf)library(ggplot2)library(ggspatial)#Read in land cover data file for 2024land_majority_lulc_2024<-sds("data_local/lulc/MCD12C1.A2024001.061.2025216131527.hdf")[1]#Read in shapefile of Nigerianigeria_borders<-ipumsr::read_ipums_sf("shapefiles/geo1_ng2006_2010.zip")|>st_make_valid()|># Fix minor border inconsistenciesst_union()|>st_transform(crs(land_majority_lulc_2024))# Convert shapefile of Nigeria to projection of land covernigeria_borders_vector<-vect(nigeria_borders)#Extract and mask land cover data to Nigerialand_majority_lulc_2024_crop<-crop(land_majority_lulc_2024, nigeria_borders)land_majority_lulc_2024_mask<-mask(land_majority_lulc_2024_crop, nigeria_borders_vector)#Identify which land cover categories exist in these dataunique(land_majority_lulc_2024_mask)#> Majority_Land_Cover_Type_1#> 1 0#> 2 2#> 3 4#> 4 8#> 5 9#> 6 10#> 7 11#> 8 12#> 9 13#> 10 14#> 11 16#Set up a color palette for land cover classeslulc_pal<-list( pal =c("#1c0dff", # 0 Water Bodies"#086A10", # 2 Evergreen Broadleaf Forest"#78D203", # 4 Deciduous Broadleaf Forest"#dade48", # 8 Woody Savannas"#fbff13", # 9 Savannas"#b6ff05", # 10 Grasslands"#27ff87", # 11 Permanent Wetlands"#c24f44", # 12 Croplands"#a5a5a5", # 13 Urban and Built-up"#ff6d4c", # 14 Cropland/Natural Mosaic"#f9ffa4"# 16 Barren or Sparsely Vegetated), values =unique(land_majority_lulc_2024_mask))color_vec<-lulc_pal$palnames(color_vec)<-lulc_pal$values#Create vector of labelsland_classes<-c("Water Bodies", "Evergreen Broadleaf Forests", "Deciduous Broadleaf Forests", "Woody Savannas", "Savannas", "Grasslands", "Permanent Wetlands", "Croplands", "Urban and Built-up Lands", "Cropland/Natural Vegetation Mosaics", "Barren")# Convert the land cover data to a factor variable to map discrete valuesland_majority_lulc_2024_mask_factor<-as.factor(land_majority_lulc_2024_mask)#Create a plot of land coverlulc_2024_graph_nigeria<-ggplot()+layer_spatial(land_majority_lulc_2024_mask_factor)+scale_fill_manual( values =lulc_pal$pal, labels =land_classes, na.value ="transparent", na.translate =FALSE)+labs(title ="Nigeria Land Cover 2024", subtitle ="NASA LULC, 500m resolution", fill ="Land Cover")lulc_2024_graph_nigeria
NASA’s Land Use/Land Cover data represent pixels of Earth’s surface using several land use classification schemes. Land cover/land use data describe human’s lived environment, in both biophysical (such as woody savannah) and socioeconomic features (urban or built up land).
LULC data is available in standardized schemes with global coverage, but also at finer spatial resolution with more specific land cover types for smaller regions. Surface reflectance is the key component of how land cover at a pixel level is determined, but other inputs are used, especially in regional data.
In addition to high-frequency LULC data with global coverage, a project out of Boston University called Global Land Cover Estimation (GLanCE) produces global coverage at an annual level, but at much higher resolution (30m).
Land Use/Land Cover data have a wide variety of applications, such as studying climate change, land use change dynamics, deforestation, urbanization, and more. The categories distinguish between different types of ecosystems, which is not easily accomplished with some of the vegetative indices described in previous posts. These data distinguish human-built impervious surfaces from bare ground/no vegetative cover.
The wide scope of spatial resolution, temporal extent, and varying number of categories make the different LULC data flexible for many applications. The exceptions being change within a year or measurements regarding health of vegetation, which are better suited for vegetative indices with a finer temporal resolution (that is, more frequent data points).
Example articles
Ganem et al 2025 uses regional LULC data to analyze land cover change in Brazil1.
Zaldo-Aubanell et al 2021 is a review article comparing different LULC approaches2.
GDLC
Measurement
Global Dynamic Land Cover (GDLC) contains land use/land cover data from the Copernicus Program, out of the European Space Agency, using Sentinel satellites. The GDLC contain 11 different land cover classes, and include layers with a specific focus on tropical forest types at high spatial resolution. Data inputs include the Digital Elevation Model, land training data, and agro-meteorological indicators.
Typical Uses
Similar to LULC, GDLC can also be used to measure land cover change dynamics, deforestation, climate change, and urbanization. GDLC is less frequent than LULC and covers a narrower time extent, but often has a finer spatial resolution. You may consider using GDLC data for focused regional projects because of the small spatial resolutions, and the distinctions drawn between tropical vegetation types in their pantropical tree cover density data. The small time frame limits its use for understanding change over time, however.
Honorable Mentions
Google Earth Engine (GEE): An open source online data platform that contains a spatial data archive from a variety of sources, as well as tools for interacting with those data. GEE contains both land cover data and imagery as well as weather and climate data.
Livelihood Zones from FEWSNET: Livelihood zone maps are country-specific map layers produced by experts with local knowledge of the predominant economic activity (for food production and income) by location. The maps are developed using factors such as agroclimatology, elevation, landcover, land use, and market accessibility. Grace and Nagle 2015 used Livelihood Zones in a study analyzing the relationship between agricultural production and fertility.3
Looking ahead
Though this is the last of three in our series describing and comparing data sources of land cover and vegetation, in the near future we will follow with a post demonstrating how to use a select number of these data to measure deforestation after a few posts on other topics.
References
1. Ganem, K. A., Xue, Y., Dutra, A. C., Pareyn, F. G. C., & Shimabukuro, Y. E. (2025). From rainforests to drylands: A context-specific framework for mapping land use and land cover dynamics in NortheastBrazil (2000–2020). GIScience & Remote Sensing, 62(1), 2510140. https://doi.org/10.1080/15481603.2025.2510140
2. Zaldo-Aubanell, Q., Serra, I., Sardanyés, J., Alsedà, L., & Maneja, R. (2021). Reviewing the reliability of LandUse and LandCover data in studies relating human health to the environment. Environmental Research, 194, 110578. https://doi.org/10.1016/j.envres.2020.110578