Why use spatially harmonized geography?
The Demographic and Health Surveys (DHS) are the leading source of population and health data for low and middle-income countries. The data from the nationally representative DHS samples can be disaggregated by regions and, in some cases, by sub-regions, such as districts. However, changes in the boundaries of reported regions are common, due to either shifts in the survey sampling strategy or due to political changes within countries. Researchers using DHS data to study change over time need to hold space constant by using regions with a consistent geographic footprint to get meaningful results.
IPUMS DHS has addressed the issue of changing boundaries by providing users with both spatially harmonized (or integrated) and sample-specific geographic variables and GIS boundaries. Harmonized variables provide consistent geographic units for a country across the sample years, facilitating analytical comparisons across time. Sample-specific variables retain all geographic detail from each sample and are not consistent over time.
The spatial harmonization process
DHS survey boundaries are obtained from the DHS Program’s Spatial Data Repository and overlaid on a GIS software system. When geographic boundaries of a later sample do not align with units of the previous DHS survey for that country because of boundary changes, we create larger aggregated units that are stable over time. We refer to this process as the spatial harmonization of geographic boundaries.
If administrative units split or merge, the harmonized unit will have the boundaries of the largest version of the unit. If a territory is redistributed between two or more units, the units are combined. Some detail is always lost in the process of spatial harmonization because administrative units are merged to find the geographic least common denominator.
In a few cases, boundaries have been reorganized to such an extent that harmonization is nearly impossible. In such cases (e.g., for Cameroon, Guinea, Jordan, and Mali), we have typically created sets of consistent units spanning different year ranges and placed them in different integrated variables. Sometimes early DHS surveys labeled regions through vague descriptive terms (e.g., “Coast” or “Mountains”) rather than naming recognized political units. In such cases, we have provided only sample-specific geographic variables (e.g. for Congo Brazzaville, Cote D’Ivoire, and Yemen).
Case Study: Access to safe drinking water
We can demonstrate the usefulness of spatially harmonized geography by creating thematic maps displaying the percentage of households in the DHS data that are using improved sources for drinking water. The United Nations’ Sustainable Development Goal 6 calls for “Ensuring Access to Water and Sanitation for All,” and the United Nations notes that access to safe water is “the most basic human need for health and well-being.”1 The U.N. further notes that water and weather extremes are linked, with droughts exacerbating water scarcity.
Improved sources of drinking water are here defined as piped water, water from wells and tube wells, surface water from springs and rivers, rainwater, and water purchased from a truck or in bags or bottles. Information about drinking water collected in DHS surveys and how that information is harmonized by IPUMS can be found in the IPUMS DHS DRINKWTR variable. More details can be found in chapter 16 of the DHS guide to statistics.
Countries and samples
In this demonstration, we will highlight the sub-Saharan countries of Malawi, Tanzania, Mozambique, Zambia, and Zimbabwe. The table below lists these countries and their sample years and notes the changes in boundaries for each country. For Malawi, we use sub-regions or the second level administrative units; here, 28 sub-regions in 2010 increased to 32 sub-regions in 2016. For Tanzania and Zambia, the regional boundaries changed from one sample to the next. For Zimbabwe, there were no changes in regional boundaries from one sample year to another. We also display a single sample for Mozambique in our year 1 maps. Note that, for the purposes of this demonstration, we do not show all the sample years available in IPUMS DHS, but rather only selected sample years.
| Country | Survey Year 1 | Survey Year 2 | Boundary changes? |
|---|---|---|---|
| Malawi | 2010 | 2016 | Yes—28 sub-regions to 32 sub-regions |
| Tanzania | 2010 | 2015 | Yes—26 regions to 30 regions |
| Mozambique | 2011 | – | No—single year with 11 regions |
| Zambia | 2007 | 2013 | Yes—9 regions to 10 regions |
| Zimbabwe | 2010 | 2015 | No—10 regions in both years |
Visualizing the percent of households using improved drinking water
All maps shown below represent the percentage of households that use drinking water from improved sources. For the countries listed in the table above, paired maps display results from two time periods. Map A shows results from the earlier survey (i.e., 2010 Malawi, 2010 Tanzania, 2011 Mozambique, 2007 Zambia, and 2010 Zimbabwe) and Map B displays results from the later survey (i.e., 2016 Malawi, 2015 Tanzania, 2013 Zambia, and 2015 Zimbabwe). Shades of the color blue represent spatially harmonized maps; shades of the color green appear on sample-specific maps. In general, the darker the color, the higher the percentage of households using improved sources of drinking water.
Figure 1 displays two sample-specific GIS maps, meaning the spatial boundaries for the two time periods for a given country are not the same. These maps show that, overall, the percentage of households using improved drinking water increased. The rate of increase differs, however, both between countries and within countries.
While very broad conclusions about change based on sample-specific geography may be sound, a closer look at the maps shows problems with using sample-specific geography. We have circled three areas affected by changes in geography. Specifically, the changes consist of splitting of boundaries in eastern Zambia (the largest circle), reorganization of boundaries in northern Tanzania (the top circle), and separation of rural and urban areas in central Malawi (the right-hand circle).
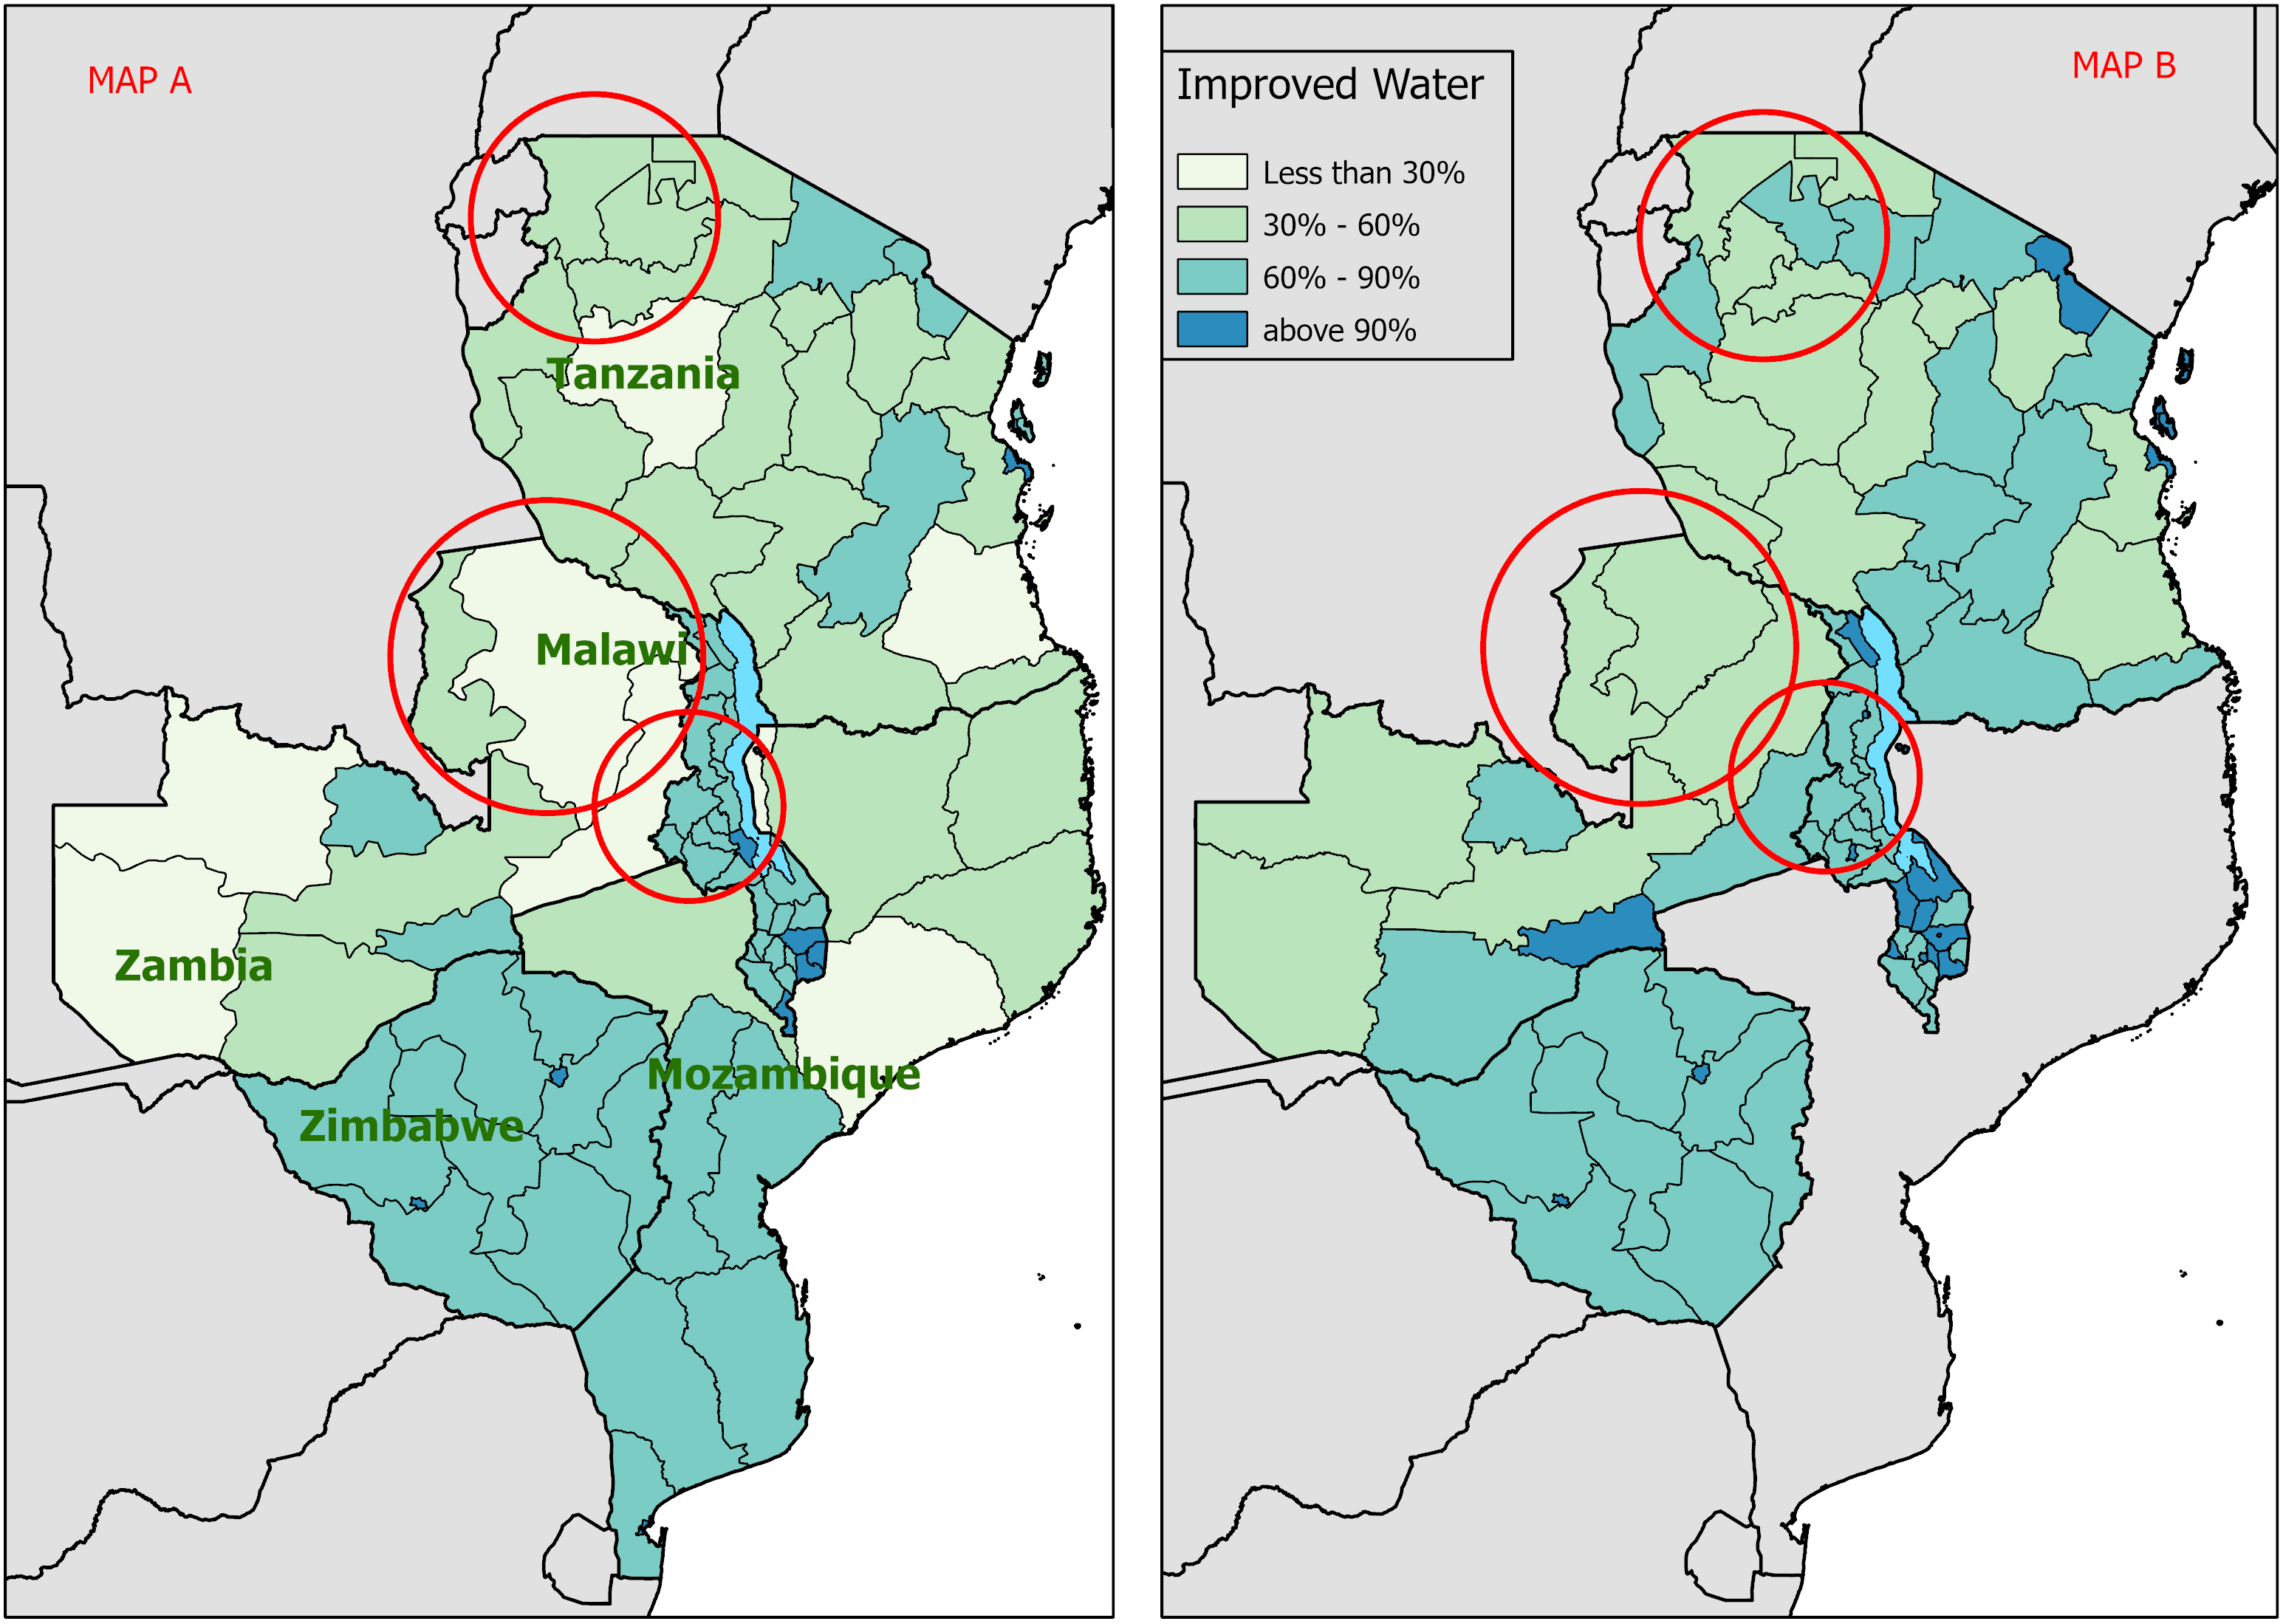
Map A shows 2010 data from Malawi, Tanzania, and Zimbabwe; 2011 data from Mozambique; and 2007 data from Zambia.
Map B shows 2015 data from Tanzania and Zimbabwe; 2016 data from Malawi, and 2013 data from Zambia.
When spatial harmonization is necessary
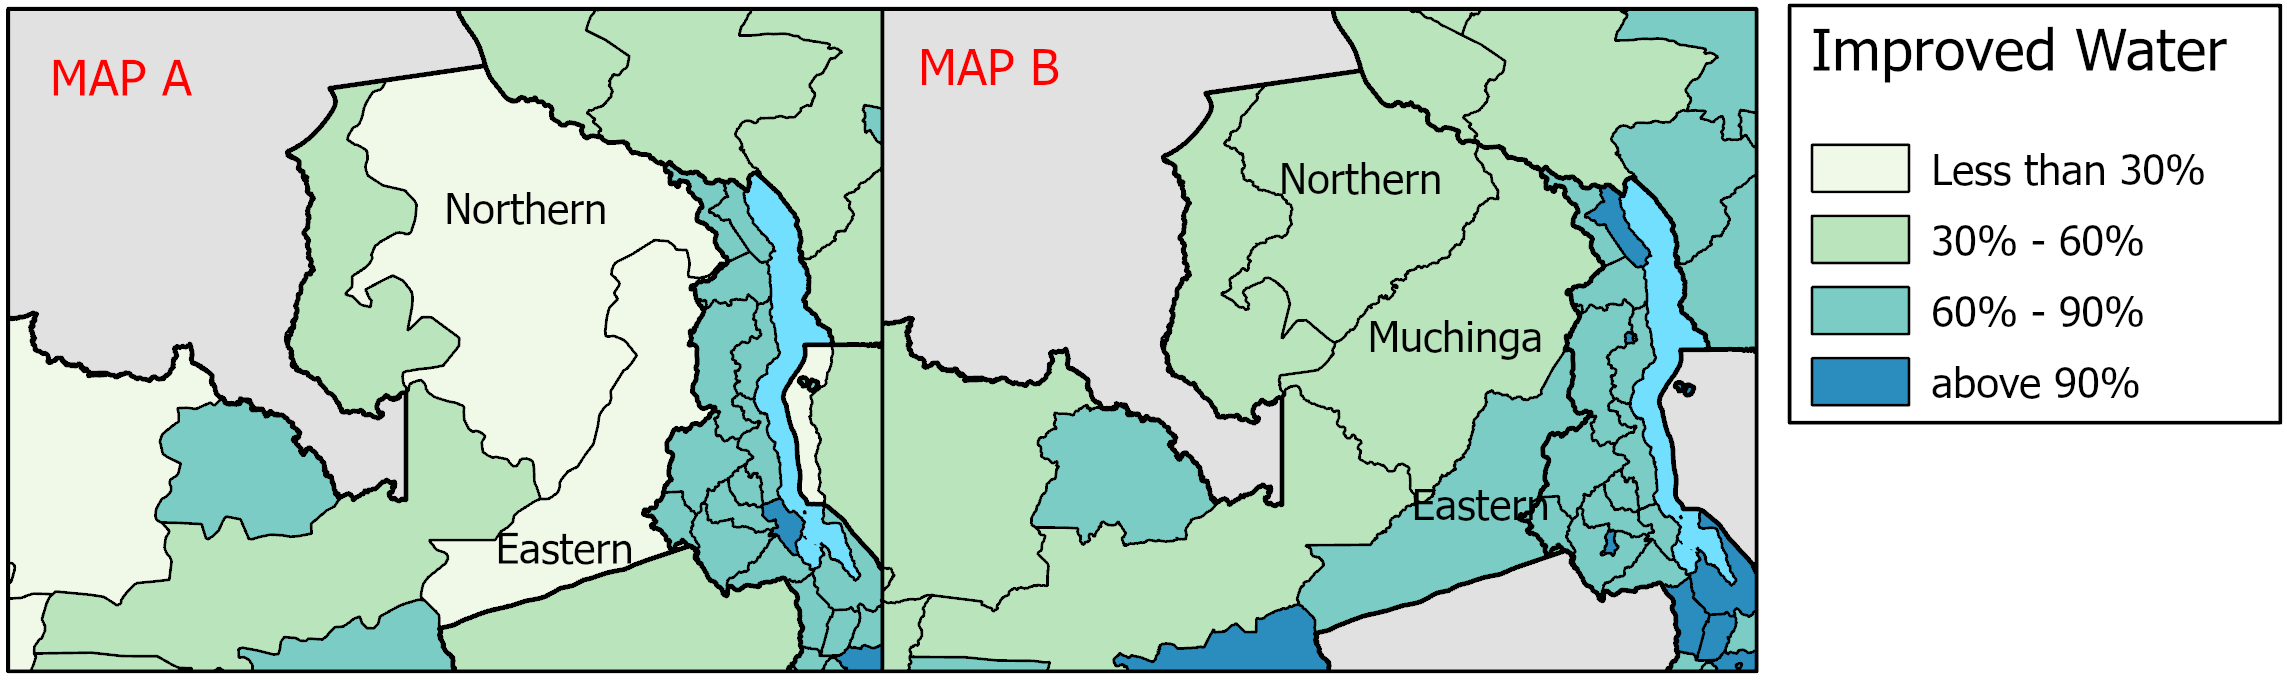
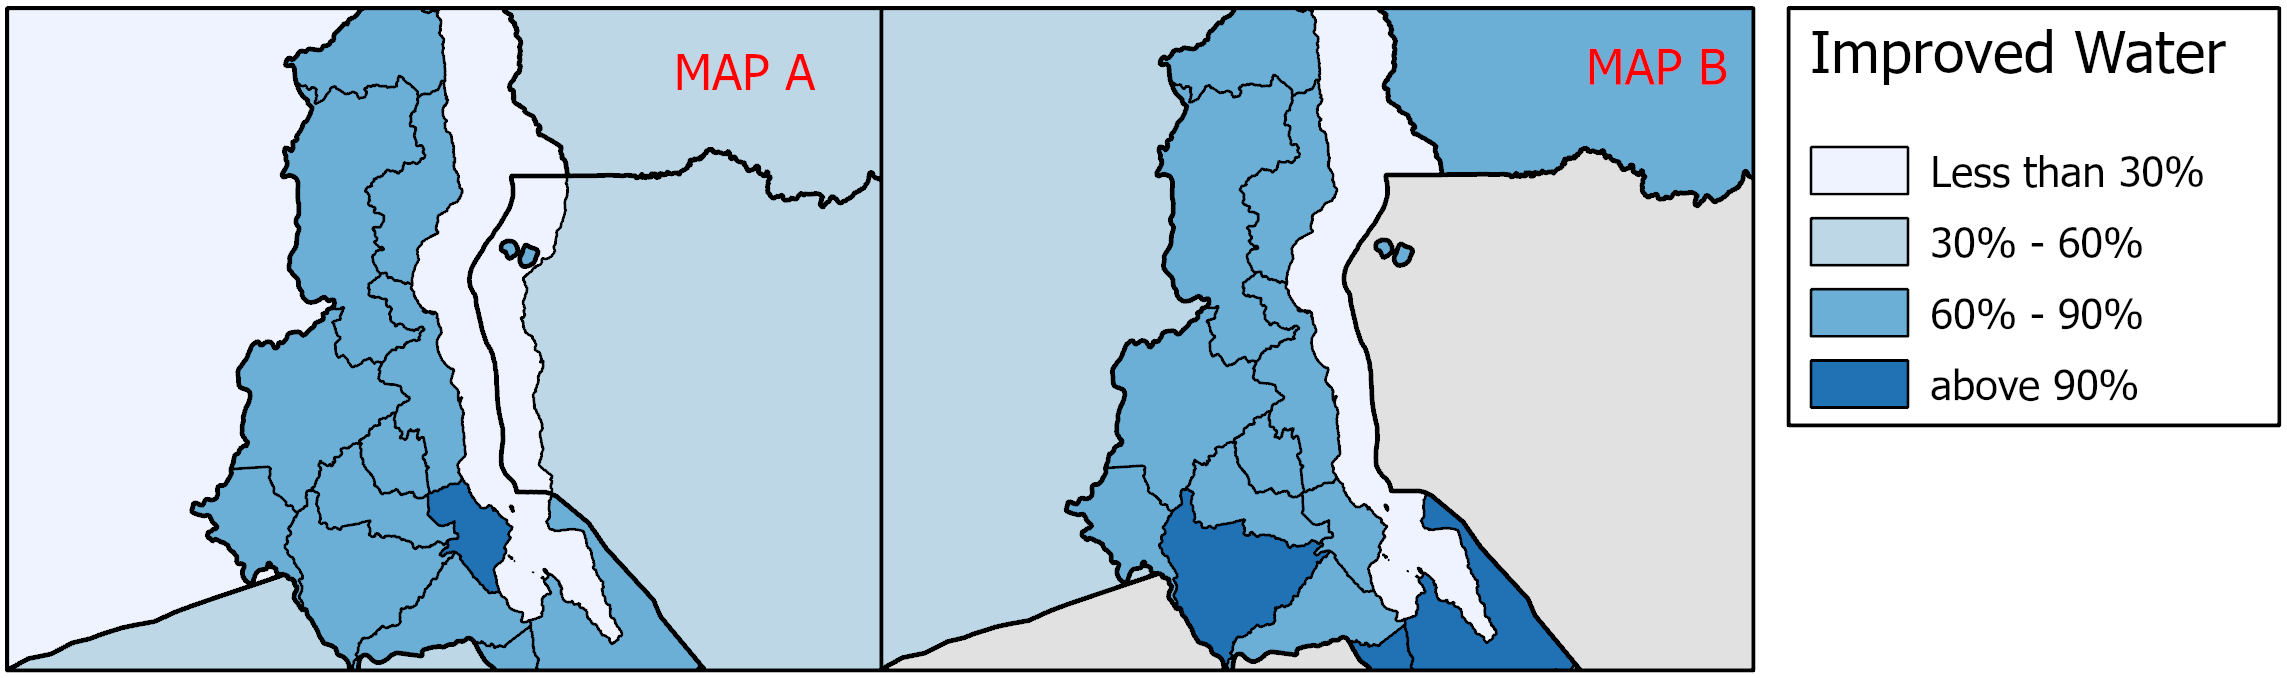
Figure 2 displays the part of Zambia where two units split up to form three units. A new political region, Muchinga, was formed from parts of the Northern and Eastern regions. Although the names of the Northern and Eastern regions remained the same, their spatial footprint changed from 2007 to 2013.
If we focus on our metric of households with access to improved drinking water, it initially appears that the percentage in the Eastern region rose dramatically from 16% to 72%, while the change in the neighboring Northern region was from 19% to 30%.
Given changes in boundaries, the apparent increase in clean water access in the Eastern region is misleading. It is quite possible that rural areas from the former Eastern region in 2007 formed much of Muchinga in 2013, with the latter having only 35% of households with access to improved drinking water. The actual change for the Eastern region may be a shift toward more urban composition as it shed rural territory, rather than a sanitation revolution.
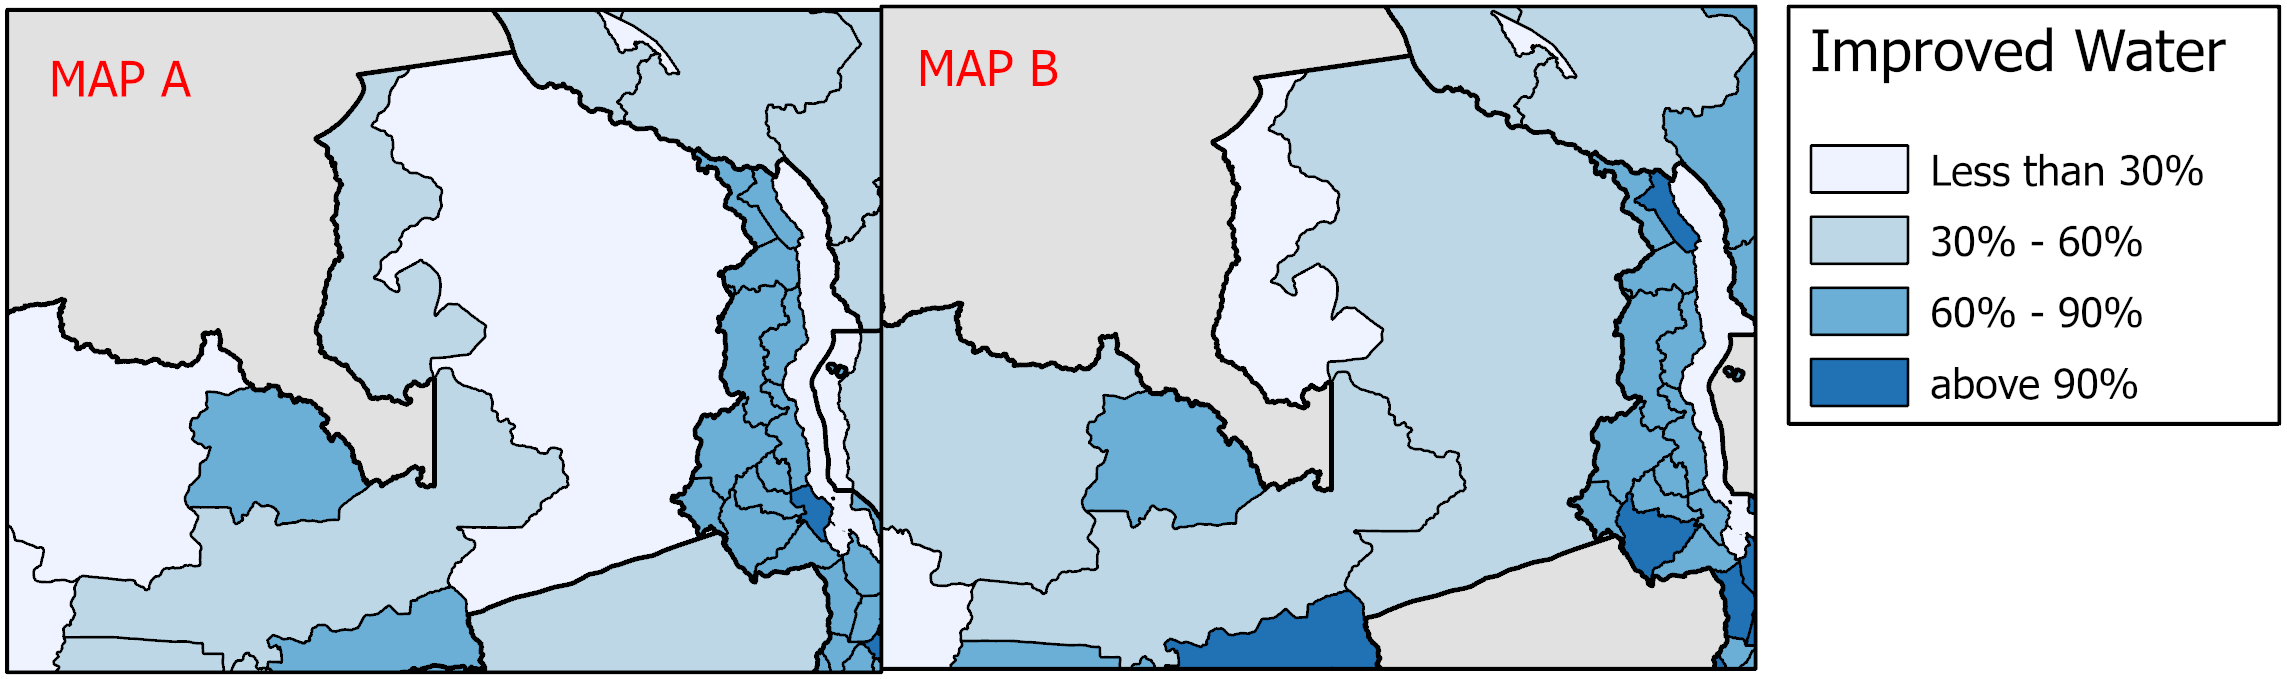
The solution to the problem of changing boundaries is imposing integrated geography for this section of Zambia. In this case, the three regions of Northern, Muchinga, and Eastern are combined into one region, with results mapped in Figure 3. Here, we see more modest improvement in this aggregated region, with the percentage of households with access to an improved water source changing from 18% to 52% between 2007 and 2013.
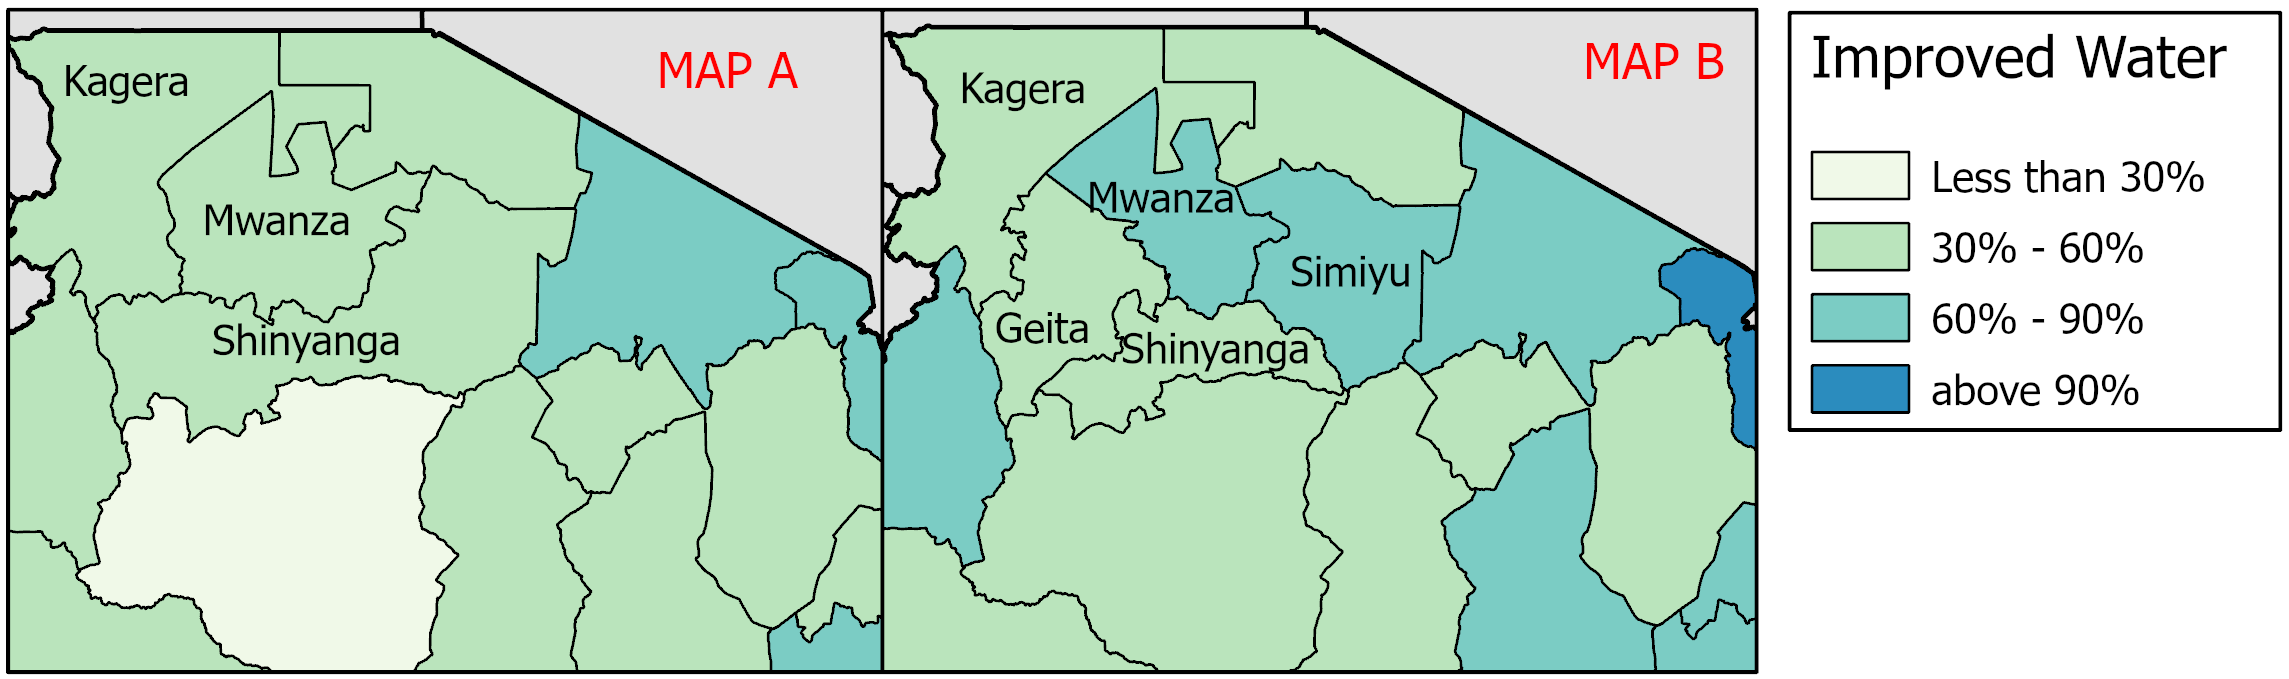
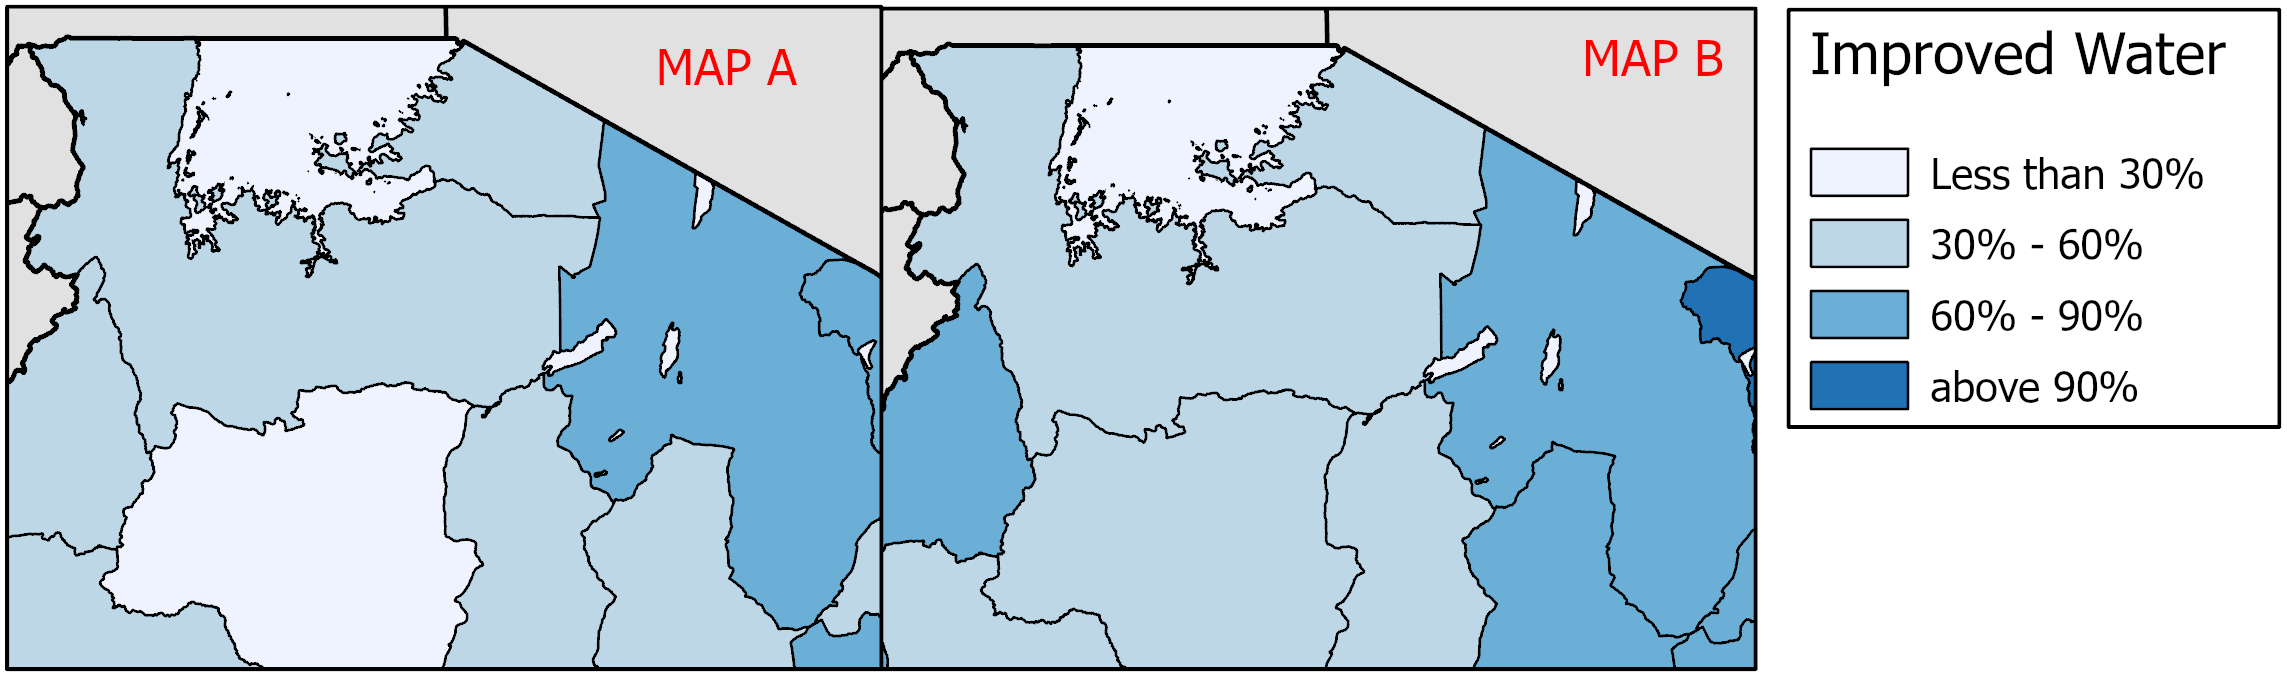
As Figure 4 shows, between 2010 and 2015, boundaries in Tanzania were redrawn such that three units (Kagera, Mwanza, and Shinyanga) were reorganized to form five units (Kagera, Mwanza, Shinyanga, Simiyu, and Geita). While it is mechanically possible to map our metric for these various regions in the two years, boundary changes preclude our drawing meaningful conclusions about progress within sub-national units. The Tanzanian case illustrates a general principle: holding space constant is critical in analyzing change at sub-national levels, because units that have changed boundaries cannot be compared across time in a meaningful way.
Creating integrated geography for this part of Tanzania required aggregating smaller units into a single larger unit, as show in Figure 5. Focusing on the single combined region, we see that the share of households with an improved source of drinking water increased from only 40% to 56% between 2010 and 2015.
Gains and losses from using integrated geography
For spatial harmonization, we hold boundaries constant over time. In our prior examples, sub-national boundaries were merged to override any boundary changes that occurred between DHS samples. While that approach enables an apples‐to‐apples temporal comparison of places, detail that might be useful for the analysis gets lost.
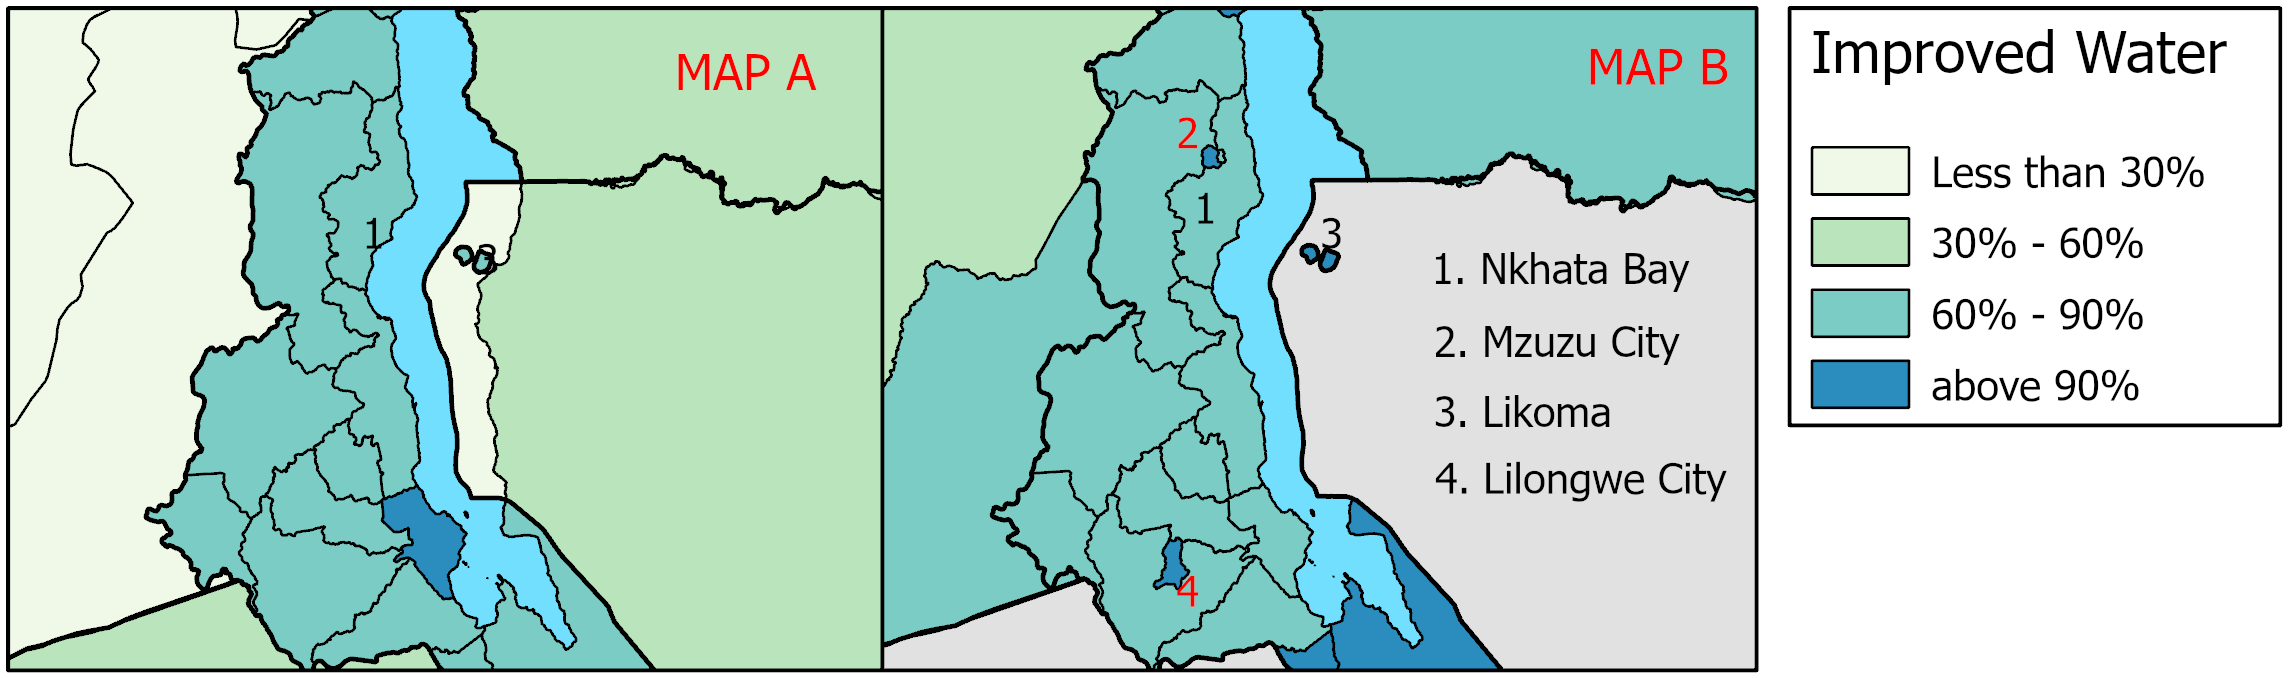
Boundary changes in Malawi illustrate this point. Consider Figure 6 and Figure 7. Map A from 2010 shows 74% households using an improved source of drinking water in Nkhata Bay, with the number inching up to 76% in 2016. The blue spatially harmonized maps in Figure 7 also show a lack of change. However, Figure 7 hides the advantaged sanitary position of Mzuzu City, which split from Nkhata Bay, with 99% of households in that city having improved drinking water in 2016. Similar results mark other urban areas, such as Lilongwe city, Zomba city, and Blantyre city (Zomba and Blantyre not displayed on the map). Taking full advantage of sample-specific geographic detail demonstrates that, in this instance, apparent regional progress in safe water access was largely localized in urban areas. As this case illustrates, sample-specific geography often provides greater detail and should be used in conjunction with spatially harmonized geography.
When geographic boundaries don’t change
While Zambia, Tanzania, and Malawi all had regional boundary changes between DHS samples, sometimes regional boundaries stay the same across two or more DHS surveys. This was the case for Zimbabwe between 2010 and 2015, as shown in Figure 8, which displays all the countries used in this demonstration. For instances like Zimbabwe, IPUMS DHS still offers multi-year “integrated geography” variables (without modifying boundaries), for the convenience of researchers and to ensure that geographic footprints as well as regional labels stay the same across time. In other cases, only a single sample is available for a country in the DHS, for all years or within a limited time span. This is exemplified by Mozambique, with a single sample from 2011 (shown in Map A but not included in Map B).
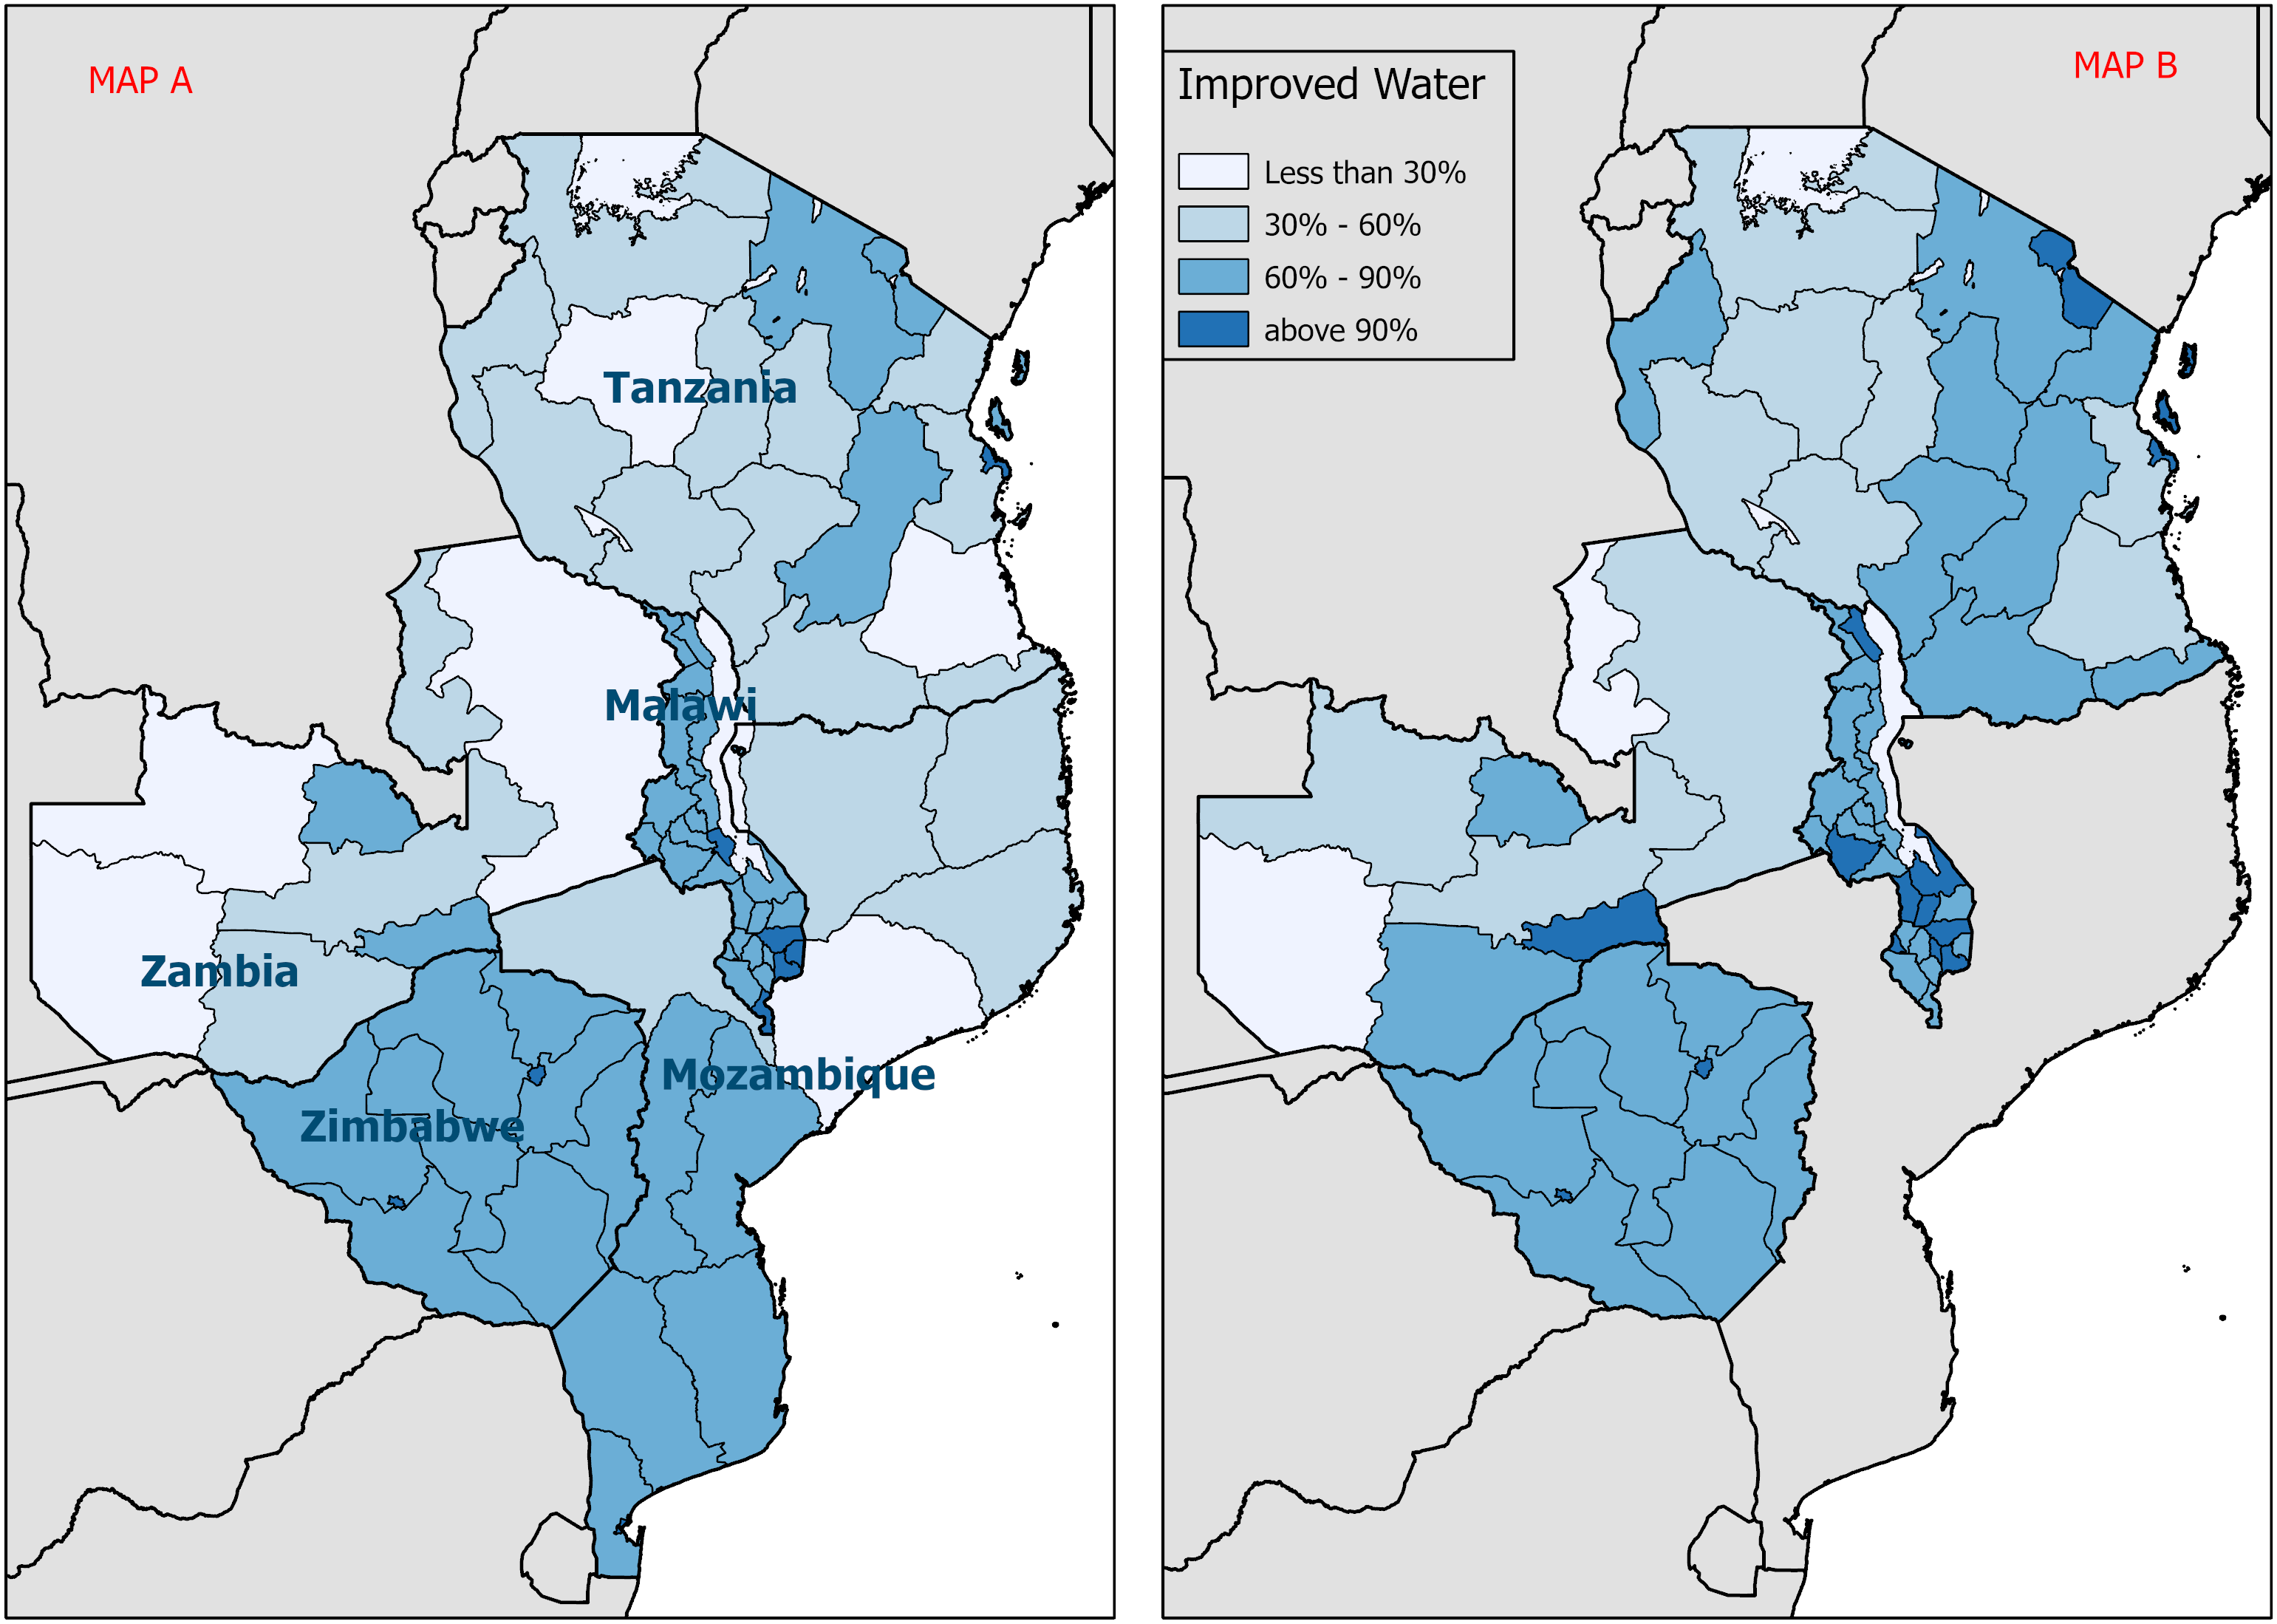
Map A shows 2010 data from Malawi, Tanzania, and Zimbabwe, 2011 data from Mozambique, and 2007 data from Zambia.
Map B shows 2015 data from Tanzania and Zimbabwe, 2016 data from Malawi, and 2013 data from Zambia.
Conclusion
This piece has stressed the importance of using spatially consistent geography while drawing conclusions over time in thematic maps. Using harmonized geographic variables from IPUMS DHS is just as essential in other approaches to studying change over time, such as summarizing results for individuals or for households via descriptive statistics or in multivariate analyses in which region is a dependent variable. Similarly, studies of the effects of localized policies, based on phased implementation of educational reforms or public health drives, must ensure that geographic variables maintain consistent spatial footprint over time.
IPUMS DHS offers several advantages to researchers, such as simplifying data discovery and file management, supplying extensive variable-specific documentation online, and allowing analysts to download customized files with just the samples and variables relevant to their research project. The integrated geographic variables and GIS shapefiles available only through IPUMS DHS are another important “value added” feature essential for sound research into change over time. See the IPUMS DHS IPUMS-DHS Geography and GIS boundary files page for more info on spatially harmonized geography.
Getting Help
Questions or comments? Check out the IPUMS User Forum or reach out to IPUMS User Support at ipums@umn.edu.